← Perspective | Measurement →
Technology
Technology is the application of science for practical purposes. But this isn’t a one-way relationship. There is a positive feedback process between science and technology. Science advances technology and technology has rapidly increased scientific knowledge through a variety of channels. The more we know, the faster we advance science.
Quantify Observations
Before any technologies were developed, all observations were qualitative. Something was hot, heavy, far away, etc. Some of the earliest technologies that supported building, navigation, manufacturing, and commerce required measurements that could be replicated. Many observations became numerical measurements scaled to a standard. Quantified observations allow us to mathematically analyze the trends and relationships of measurements.
Consider the history of the thermometer and temperature scales. Galileo invented the thermometer in 1593, but the Fahrenheit temperature scale was not established until 121 years later. So even though there were thermometers, before 1714, the measurements were only comparable for a single instrument since there was no standard to calibrate to. Until a standard was established, the science we could learn using a thermometer was limited. The Celsius temperature scale was created in the early 1740s, and as science continued to develop, the Kelvin temperature scale was established in 1862. The technology of thermometers expanded our understanding of the thermal energy, which in turn, demanded improved technologies to measure temperature.
Enhance Our Senses
As illustrated with the activities from Our Senses and Brain, all senses have limits on what they detect. We can’t see every shade of color, we can’t hear every pitch of a sound, or smell or taste every molecule. Technologies have expanded our senses, helping us detect things missed by our senses, but as with our senses, every technology has a threshold of what it can and cannot detect. Similar to how we tested our senses, every technology’s capabilities and limitations must be measured.
Expand Beyond Our Senses
We only have five senses, but there are so many other phenomena around us. Magnetic fields, x-rays, electric fields, ultraviolet, ultrasound, gravity waves, infrasound, seismic waves, etc. Technologies have opened up worlds to observe we didn’t know were there.
Observe From New Perspectives
Before the hot air balloon, humans were confined to the ground. But humans first took to the sky in 1783, and seeing the landscape from above allowed us to see new connections between land features. When cameras became portable enough, they were taken aloft in balloons by 1858. The first satellite orbited Earth in 1957, and it was rather primitive since the main focus was getting the object into space. The first satellite that carried a camera began orbiting Earth in 1960, and the first image showed large scale cloud features of large storms. Aerial/satellite images have changed how we understand Earth’s interconnected processes, Earth’s systems, as well as explore the history and processes of our universe.
We don’t just look at objects from far away. We also view things too small for us to see our eyes. Microscopes using a variety of technologies now allow us to view objects as tiny as atoms and molecules.
Our eyes and brain can’t observe things moving or changing at rapid rates. Ultra-high-speed imaging technologies not can watch light moving within a small space.
We also can’t see through walls with our eyesight, but certain technologies can. We peer into our bodies to monitor the working functions of our brain, heart, lungs, and circulatory system. Breakthroughs in neuroscience are occurring rapidly due to non-invasive, real-time imaging of electrical and blood flow patterns in the brain.
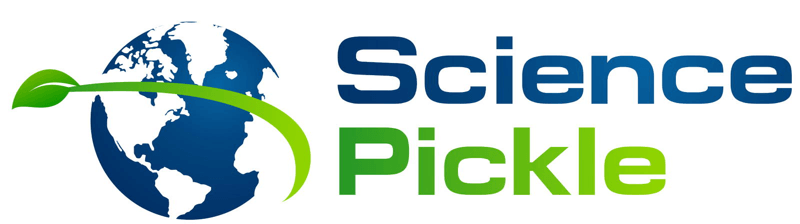
Technologies allow us to carry and control a camera taken aloft on a kite.
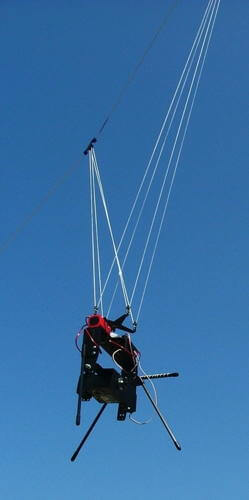
A digital photograph of a landscape while standing on the ground.
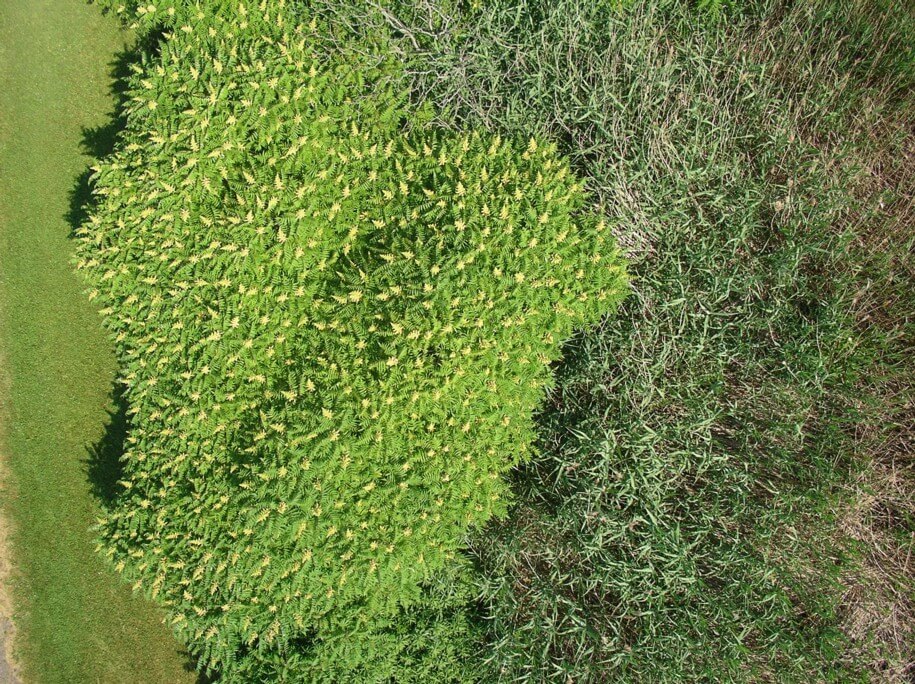
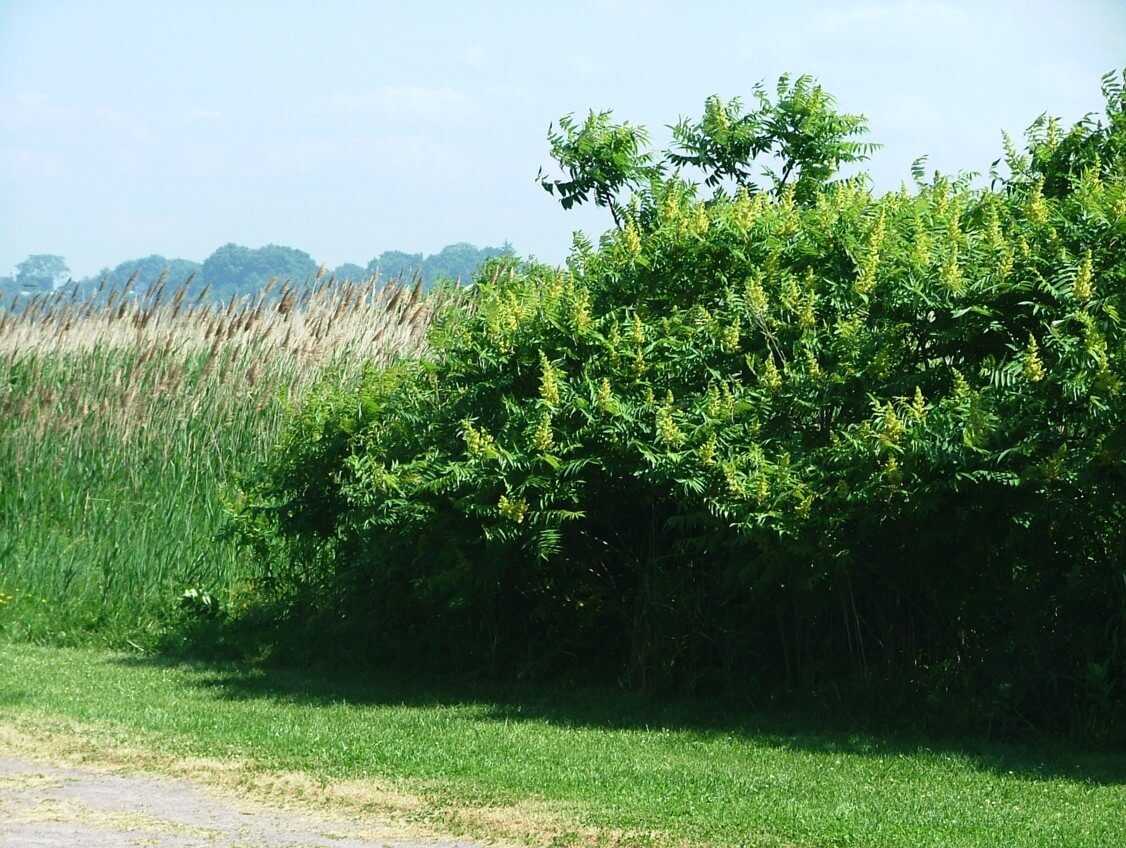
A digital photograph of the same landscape but taken from above with a camera on a kite.
Communications
We can’t be everywhere at once, and we can’t have instruments placed at every location, but luckily communication technology brings together observations spread out over great distances. The development and deployment of the telegraph illustrate the importance of bringing data spread out over the United States efficiently and effectively.
The telegraph sent its first long-distance message in the United States (from Washington, D.C. to Baltimore, Maryland) in 1844. With the success, networks of telegraph wires started to be built across the country although the expansion slowed during the Civil War (1861 to 1865). By the early 1870s, weather data were being telegraphed into a central location and analyzed by meteorologists, and for the first time, they could see the size and shape of weather systems and how they moved and intensified. This was the beginning of weather forecasting.
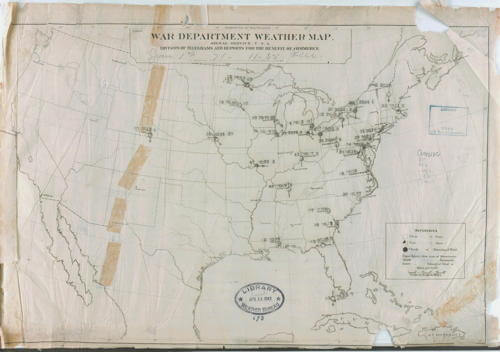
Earliest available archived weather map available at the National Oceanographic and Atmospheric Administration central online library, January 1, 1871. Weather maps from 1871 until the present day are available for free.
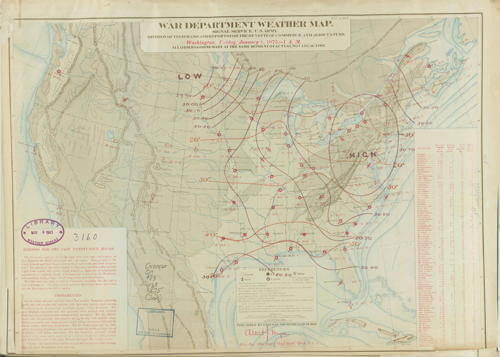
Weather map for January 1, 1876. Notice the expanded network of weather stations, and that data are now contoured. Isobars (pressure contours) are black, and isotherms (temperature contours) are red.
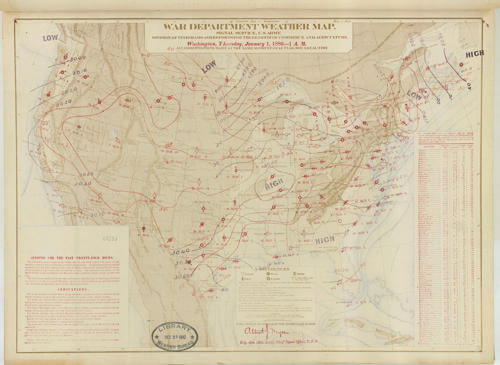
Weather map for January 1, 1880, only 9 years after the one shown above. Weather data now extends across the United States.
How Much Data Do We Need?
Time and space have scales ranging from incomprehensibly tiny to unimaginably large. Considering timing, how often should something be measured? “How Often Should I Measure the Weather?” is an experiment to decide how often the weather needs to be measured.
Below is an Excel file with data sets with 24 hours of weather data (surface temperature, relative humidity, dew point temperature, and air pressure). There are 6 data sets based on different time intervals: every 15 minutes, 30 minutes, 1 hour, 2 hours, 4 hours, and 8 hours. Analyze the data sets to see how they are similar and different when describing the weather conditions on the same day. There are also guiding questions to help provide some ideas for analyzing the data.
Files for ‘How Often Should I Measure the Weather?’
Excel file of weather data: surface temperature, dewpoint temperature, relative humidity, and air pressure.
Questions to help develop your data analysis.
Excel file of analyzed weather data.
Answers to the set of questions above.
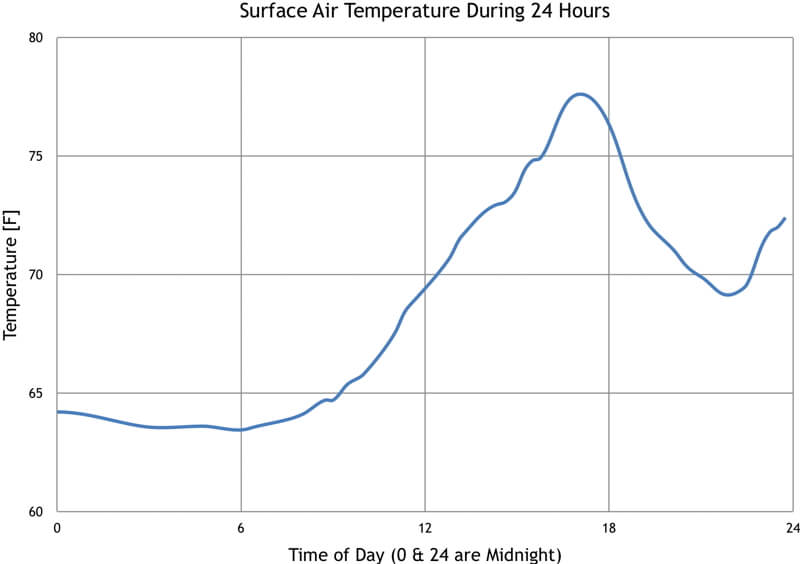
Temperature change throughout a day using measurements every 15 minutes. Do we need more than this? Fewer? Explore the activity “How Often Should I Measure the Weather?” to test your ideas.
Observing with Cameras
Digital cameras with video and time-lapse options are excellent tools for observing and measuring how objects change position, rotation, orientation, shape, color, behavior, etc.
This video provides some examples of how to observe nature with digital movies. One example explores how changing the time interval affects seeing vertically moving clouds in severe weather.
To practice observing, consider watching the movie the first time with the sound off, then watch it again to compare what we both observed.
Storing and Sharing Observations
Sharing stories was an early form of storing and passing along observations. Paper quickly became useful to accumulate and organize observations, and it lasted as the ‘go to’ medium for over 3,500 years.
Computers have changed all of this, and the amount of data collected each day is staggeringly large, and it is growing rapidly with each advancement in technology. As more and more data are stored and shared on the “Cloud”, more data will be processed to create more data.
Processing Observations
Observations get analyzed, modified, incorporated, merged, forecasted, and shared, rapidly expanding the data being stored and transmitted around the globe. Weather observations are used in weather forecasts; analyzed to create weather maps; shared with businesses, safety organizations, military, governments, and the general public. Each form to data created from the weather observations is stored. And this is only for weather data – think of the data collected and analyzed in the financial sectors, military, medicine, education, government, etc.
Observing 24/7
Humans need to sleep and do other life functions, so we can’t be observing at all times. Technologies are changing this. We now have weather satellites orbiting Earth, capturing images of our atmosphere every few minutes. And since we’ve been monitoring Earth from satellites since 1960, we have a record of observations that allow us to see the effect of very slow processes, such as the rate of plate motion, isostatic rebound since ice sheets retreated from high latitudes during the past 21,000 years ago, mountain building due to continental collision, etc.
Too Much of a Good Thing?
We are in the Information Age, the period in human history characterized by information gathering and distribution through computerization. Our brains can only process so much sensory information in a given time, and information is sent to us primarily through sight and sound. This near-constant sensory input is impacting us in many ways we may not want, and we may not be as productive as one would expect.
← Perspective | Measurement →
Topics in Observing
- Our Senses and Brain
- Perspective,
- Technology,
- Measurement,
- Data, Graphs, and Functions
- Function Transformations
- Contouring, and
- Improving Observational Skills.
Measure your:
0 Comments