
Clouds and Earth’s Radiation Budget
Clouds and Visible Light to Near-Infrared
Clouds are between the Earth’s surface and the Sun, and liquid water-droplet clouds are quite reflective of the Sun’s short wavelength radiation (visible light and near-infrared). Examine the two photographs of the same scene of clouds, ocean, and land. The first image is a color photograph, so it is in visible light. The second image is a black and white image taken in the near-infrared. In both images, the clouds are reflecting the Sun’s incoming visible light and the near-infrared. Using the Blackbody Radiation software, the Sun emits about 10% ultraviolet, 45% visible light, and 45% near-infrared, so clouds are reflecting a great deal of the incoming Sun’s radiation back to space so it can’t warm the Earth’s surface. So the clouds in these photographs cool day time temperatures.
Clouds and Far-Infrared
Clouds absorb the longer wavelengths of infrared, mid and far-infrared, emitted from the heated Earth’s surface. The warmed clouds emit roughly half back to the Earth’s surface, so clouds also have a warming component. During the day, this warming offsets a portion of a cloud’s cooling effect. At night, clouds have a net warming effect since the clouds keep a portion of the far-infrared emitted from traveling to space.
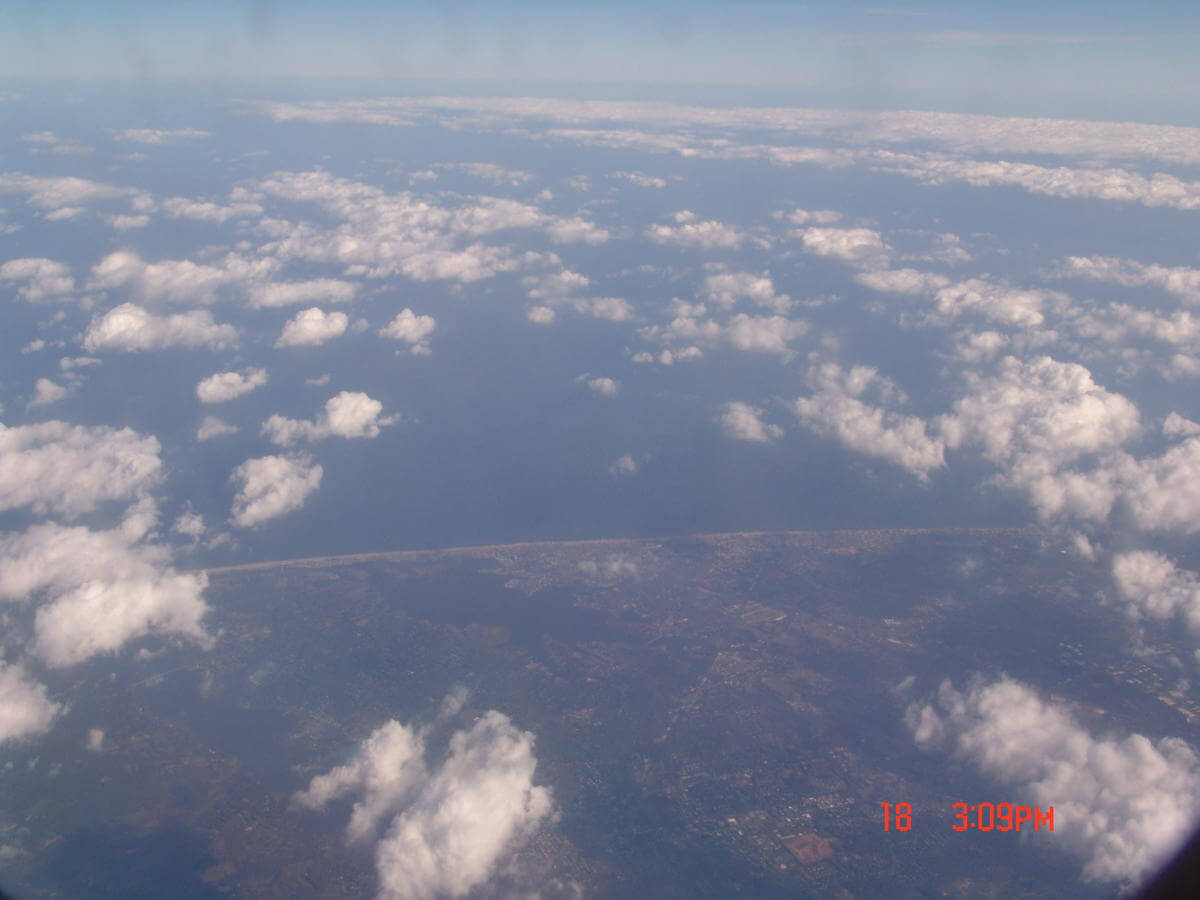
Image of clouds and coastline in visible light. Notice clouds are highly reflective.
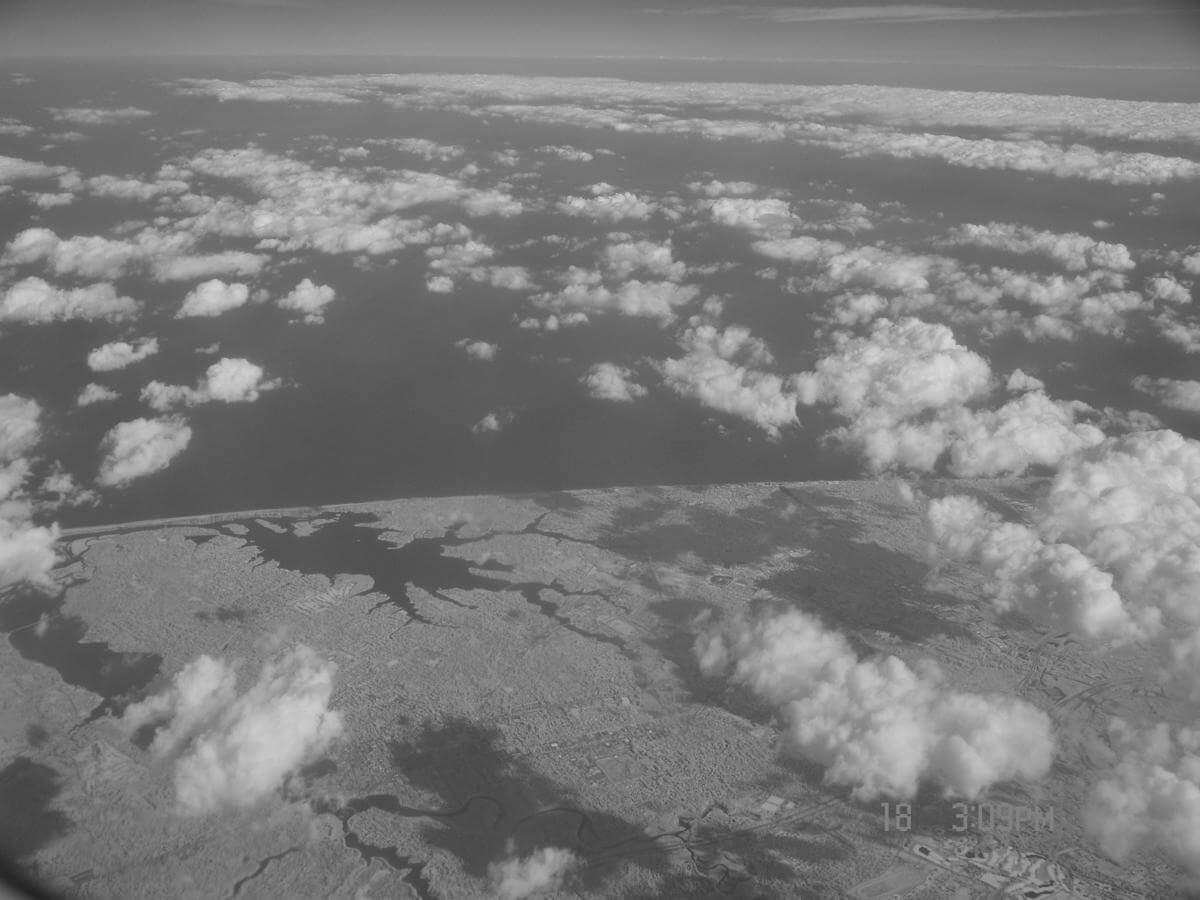
Same image of clouds and coastline in near-infrared (NIR). The clouds are still very reflective.
Low versus High Clouds
Cirrus consists of tiny ice crystals, so they form at high altitudes where is it frigid. Thin cirrus clouds reflect less sunlight than liquid water clouds but absorb mid- to far-infrared emitted from the surface. Due to their low temperatures, cirrus clouds emit less far-infrared to space. Coupled with their low reflectivity of sunlight, cirrus clouds have a net warming effect during the day. At night, the thermal radiation emitted from the cirrus toward the Earth’s surface has a net warming effect.
Liquid-water clouds form lower in the atmosphere, and they are typically thicker than cirrus clouds. They reflect a great deal of sunlight, and being warmer, they emit significant amounts of far-infrared toward Earth and space. The increased thermal radiation at the surface negates some of the cooling effects during the day, but there is still a net cooling, particularly by stratocumulus clouds.
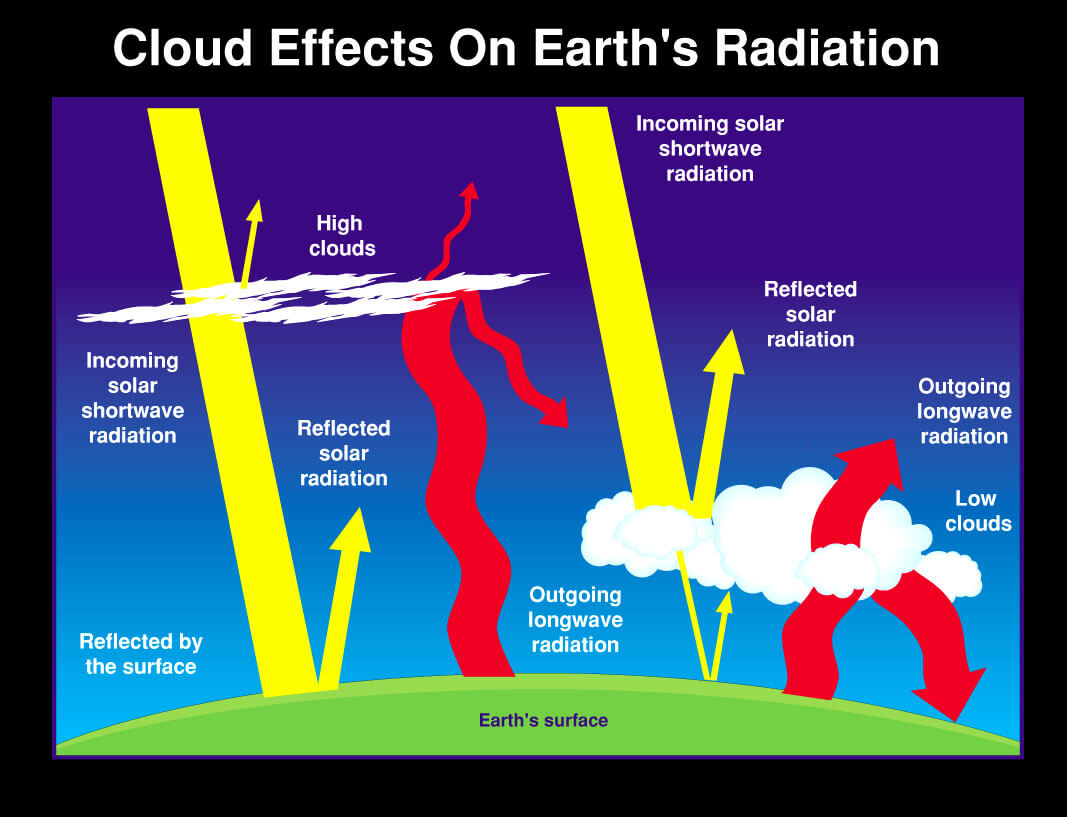
The diagram shows the generalized effects of low and high clouds on Earth’s radiation budget. Low clouds have a net cooling effect on Earth, while high cirrus clouds have an overall warming effect. The diagram is from the Climate4You website in the Climate and Clouds section.
Clouds Around the Globe
Weather satellites have been monitoring Earth’s atmosphere since April 1, 1960. As sensor and communication technologies have advanced, we see finer and finer detail in cloud cover. Compare the first weather satellite image (Tiros) to that of the geostationary satellite, GOES, taken in 2017.
With well over 50 years of cloud data, meteorologists have studied the seasonal aerial distributions of clouds. At any given moment, clouds cover two-thirds of the Earth, so they have a considerable impact on Earth’s radiation budget.
Because of the extensive and complex role of clouds, internationally coordinated research started in 1983, and research continues to improve our understanding of clouds’ impact on climate change.
The first weather satellite, TIROS, sent its first image of Earth’s cloud cover on April 1, 1960. The grainy black and white image helped meteorologists see patterns of cloud cover over the ocean, helping to provide a better understanding of weather patterns over what were previously very remote to human observations. Image from NASA.

Satellites carry sensors that detect radiation in a variety of wavelengths. Weather satellites monitor clouds using wavelengths ranging from visible light to microwaves (a subset of radio waves).
Thermal infrared sensors allow meteorologists to view clouds during the night and day, whereas visible light images need sunlight to illuminate the clouds. Thermal infrared images indicate the altitude of the cloud top too.
There are two primary types of weather satellites: polar-orbiting and geostationary. Polar-orbiting satellites are closer to the Earth’s surface, and they see a strip of Earth as they travel between the poles. Geostationary satellites orbit farther from Earth, so it travels more slowly. These satellites complete a revolution at the same rate as Earth, so they remain over the exact location, allowing us to study how clouds change shape and move over time. To see movies of clouds associated with different weather events, visit the GOES pages at NASA.
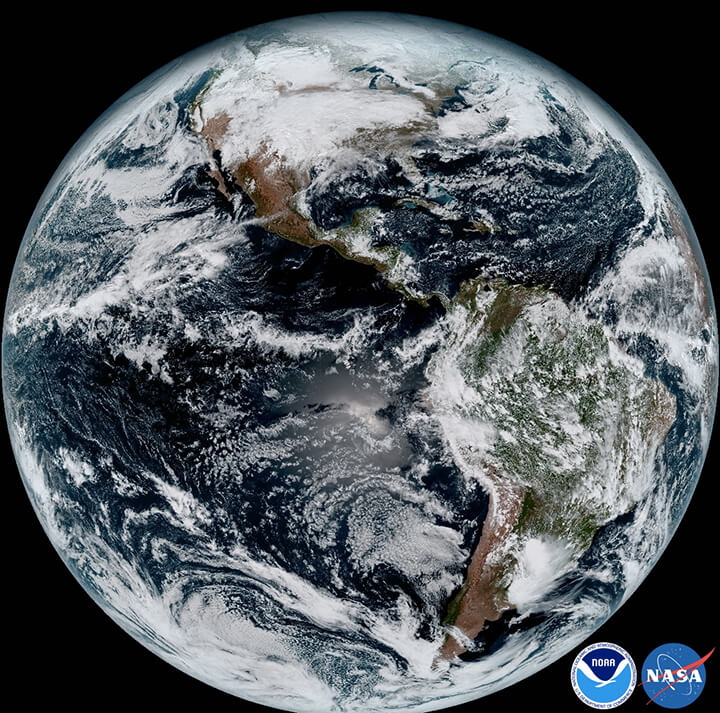
The visible-light image of Earth was taken by a GOES satellite on January 15, 2017. Clouds appear white in the image. Image from NASA.
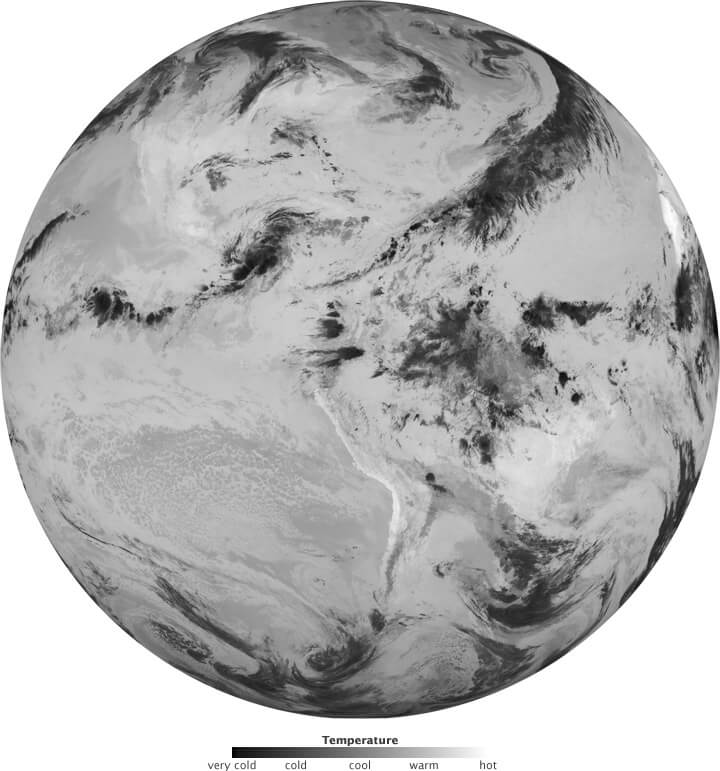
The thermal infrared (far-infrared) image was taken by a GOES satellite on May 30, 2010. Cold cloud tops that are high in the troposphere emit less thermal energy compared to lower, warmer clouds — image from NASA.
Clouds and Seasons
The Earth’s tilt of its axis of rotation from its plane of orbit, or its obliquity, creates our seasons. When the northern hemisphere is more illuminated during its spring and summer, the southern hemisphere is less bright. The changing illumination of Earth creates the tropical zone of maximum heating to move north and south of the equator, which in turn alters global wind circulations. Clouds depend on the availability of water vapor. Since it is readily available over the oceans, the oceans are typically 90% covered by clouds, whereas, over land where there generally is less water vapor, there is 70% cloud cover. Since there is more land in the northern hemisphere, there is a seasonal change in global cover due to the distribution of land between the hemispheres.
The diagram illustrates the variations in total global cloud cover between 1987 and 2010. The x-axis labels indicate day/month/year. The uneven distribution of land and oceans between the northern and southern hemispheres creates the seasonal variation of the cloud cover — Diagram from the ‘Climate + Clouds’ section of the Climate4You website.
The diagram illustrates the variations in cloud cover at different elevations between 1987 and 2010. The diagram illustrates the variations in total global cloud cover between 1987 and 2010. The x-axis labels indicate day/month/year. The uneven distribution of land and oceans between the northern and southern hemispheres creates the seasonal variation of the cloud cover — Diagram from the ‘Climate + Clouds’ section of the Climate4You website. There is a decrease in low-level clouds, and increases in middle and upper-level clouds. The diagram is from the ‘Climate + Clouds’ section of the Climate4You website.
Clouds and Net Radiation
Net radiation is the rate of incoming radiation minus the outgoing radiation. When inbound is higher than outgoing, the positive net radiation leads to heating. When outgoing exceeds incoming, the region cools.
As discussed above, clouds have a complicated role in Earth’s radiation budget. Day or night time, liquid water droplets versus ice crystals, seasonal patterns, and clouds over land or water are just the staring set of variables. But understanding clouds’ roles in warming and cooling the planet are critically important to analyze and predict the impact of human-driven climate change.
Scientists have been studying the impacts of clouds through international efforts such as the International Satellite Cloud Climatology Project (ISCCP) since 1982. And the research continues to improve our ability to model the formation of clouds to finer spatial resolutions in long-range climate models, such as those used by the International Panel on Climate Change (IPCC). Clouds remain one of the leading contributors to uncertainty in analyzing and predicting climate change.

Above are two sets of data for July 2006: monthly cloud cover (1 = 100% and 0 = 0%) and monthly net radiation (outgoing – incoming). Data are from NASA. Go to the site to see how the data changes from July 2006 through September 2019.
0 Comments