
Precipitation and the Water Cycle
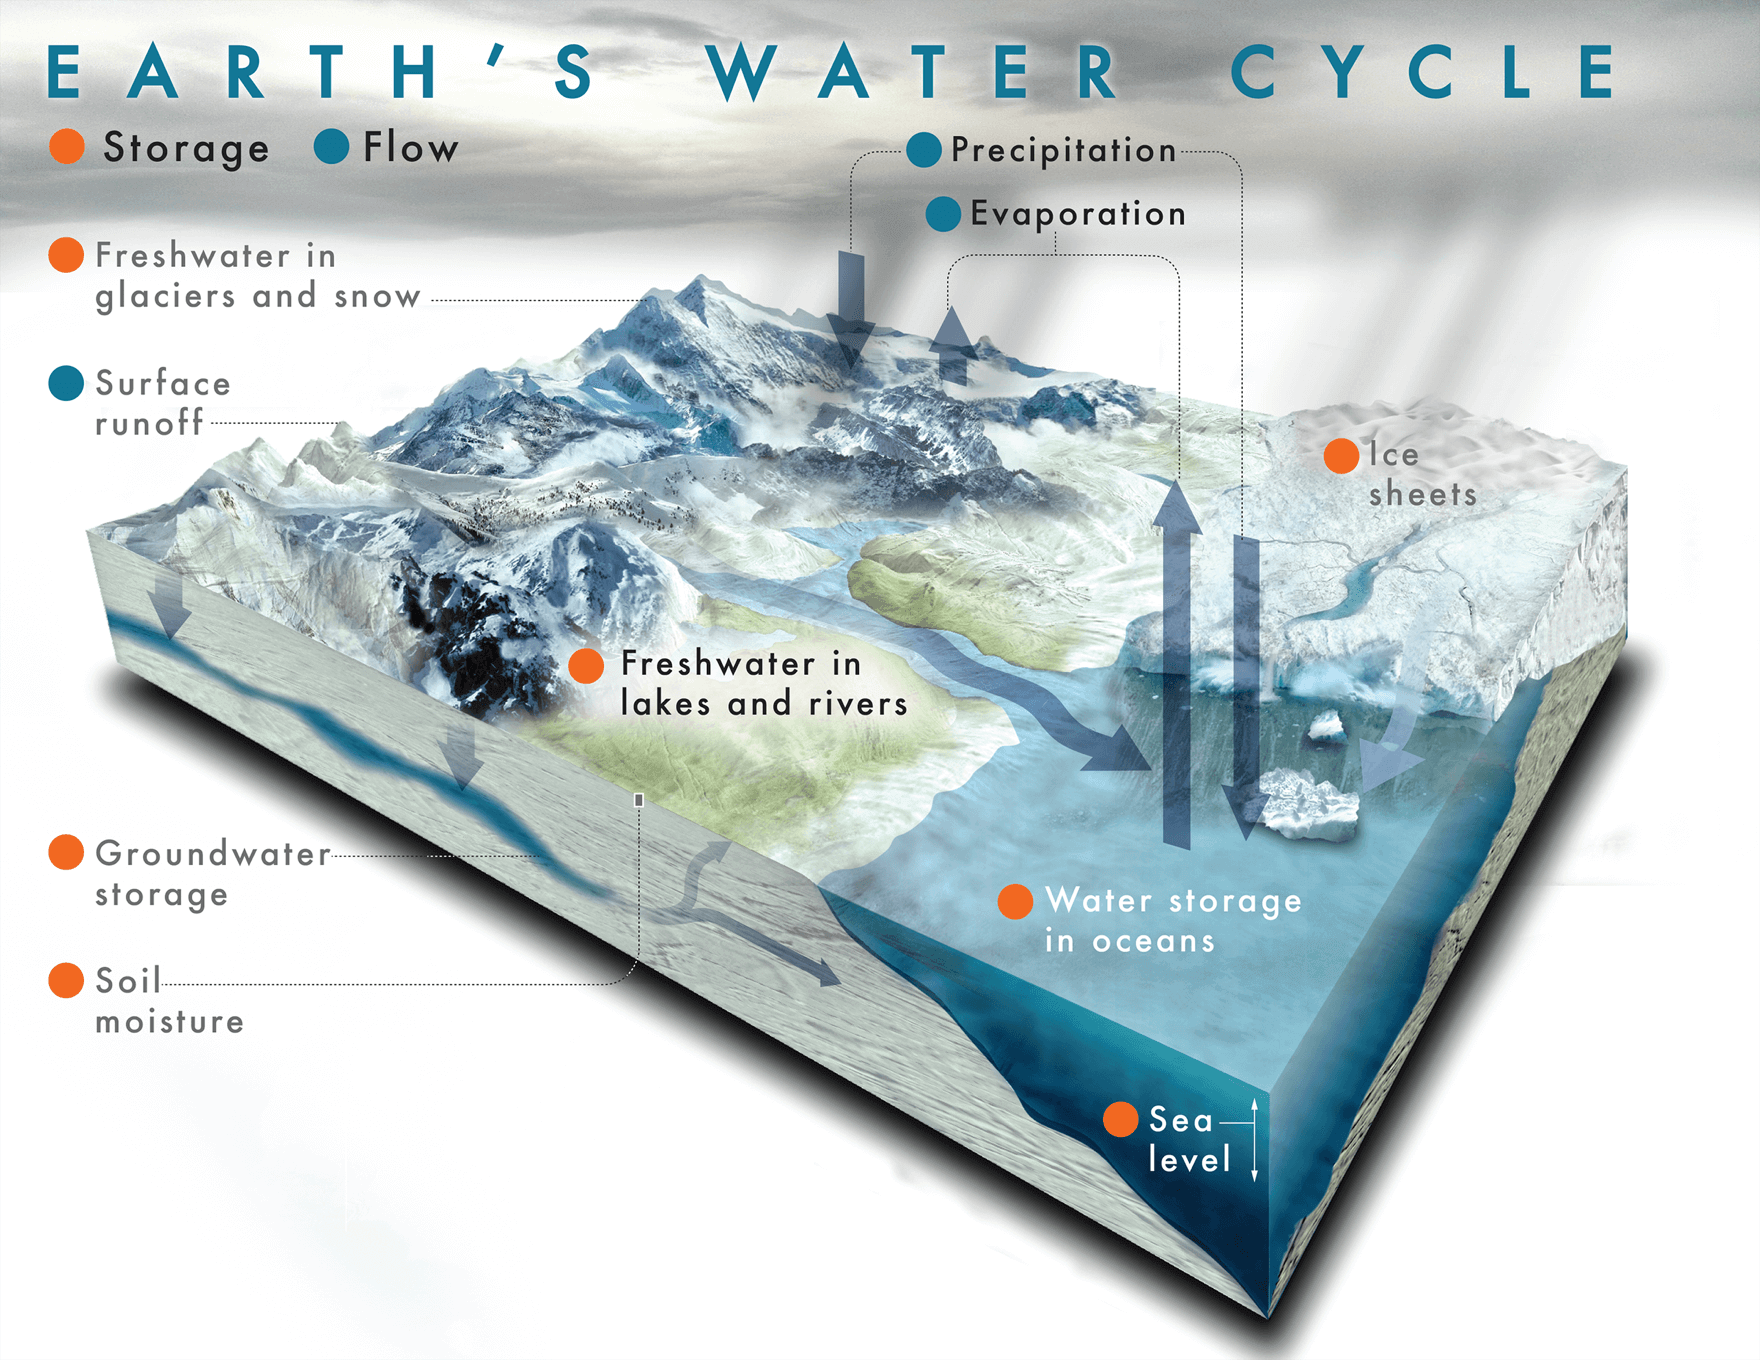
Water covers three-quarters of the Earth’s surface, and the oceans contain 97% of the water available at and near Earth’s surface. Evaporation and precipitation are the two processes that move water from the oceans to the other reservoirs. Evaporation from the ocean’s surface allows water vapor to form clouds and precipitation over land and oceans. Wind transports water vapor over land, creating precipitation that falls in liquid and solid forms. The liquid form flows in rivers and into the soil and rocks, eventually returning to the oceans. Snow and ice that last all year long on land store a sizeable amount of water from returning from the ocean for long periods of time.
The diagram from NASA JPL (right) illustrates how water moves between various reservoirs. How long a water molecule stays in a reservoir is its residence time. Water may be locked up in one reservoir for hundreds of thousands of years (there is ice in Antarctica over 400,000 years old). For example, humans living in dry regions are removing underground water thousands of years old, and it will take thousands of years to replenish by natural processes.
Click the button to simulate the water cycle processes.
Create your own experiments with the water cycle model in Google Sheets:
Below are supporting materials and additional links to run the app and models.
Matter Cycles
Earth systems involve the interconnection of energy flows, matter cycles, and life webs. The water cycle is the first of the matter cycles to be explored since it plays such significant roles in Earth’s energy flows and life webs, as well as impacting many of the other matter cycles.
As matter moves through its reservoirs, it may change phase, which is a physical change, or it may change chemically. In the water cycle, water molecules change phase only, whereas, in the carbon cycle, carbon goes through many chemical transformations, such as becoming carbon dioxide, fossil fuel (oil, gas, or coal), limestone, organic molecules in plants and animals, etc.
Note that the chemical reaction of water in photosynthesis has not been included in the water cycle. During photosynthesis, water’s hydrogen is incorporated into carbohydrates and its oxygen is released into the atmosphere. During plant and animal respiration, carbohydrates are broken down into water and carbon dioxide. These processes will be explored further in the carbon and oxygen cycles.

The concept map of the water cycle shows reservoirs of water as boxes and the processes that move water between the reservoirs in labeled arrows. This concept map shows the many pathways a water molecule may experience as it moves through the water cycle, but it doesn’t provide data of how long it may reside in a given reservoir or the number of molecules in each.
Reservoir Size, Rate of Transfer From the Reservoir, and Residence Time
Residence Time is the average amount of time a molecule would stay in a reservoir before being transferred to another. Mathematically, the residence time is calculated by:
Residence Time = Number of Molecules in Reservoir / Rate of Molecules Transferred From or Into the Reservoir
Below are the percentages of water within the Earth’s reservoirs and the residence times. To gauge the relative magnitude of the processes removing water from the reservoirs, use:
Relative magnitude of the Rate of Molecules Transferring From the Reservoir = Percent of Water within a Reservoir / Residence Time
Data are illustrating the volume of each reservoir in total water and freshwater, the residence time within the reservoirs, and the processes that remove water from the reservoirs. Data are from USGS Water Cycle, OpenLearn’s Water Use, and Lumen Learning Hydrologic Cycle.
| Reservoir | Amount of Water At/Near Earth’s Surface [%] | Amount of Freshwater [%] | Residence Time | Processes that Remove Water From Reservoir |
| Ocean | 96.54 | – | 4000 years | Evaporation |
| Glaciers / Ice Caps | 1.74 | 68.7 | 800 years |
Melting and flowing into a river or percolating into groundwater; Sublimation |
| Groundwater | 1.69 | – | Weeks to 10,000 years | Flow into lakes and rivers |
| Fresh | 0.76 | 30.1 | ||
| Saline | 0.93 | – | ||
| Lakes | 0.013 | – | Several years |
Flow into rivers; Percolation into groundwater; Evaporation |
| Fresh | 0.007 | 0.26 | ||
| Saline | 0.006 | – | ||
| Soil Water | 0.0001 | 0.05 | Weeks to a year |
Runoff into rivers; Absorbed by plant roots; Evaporation |
| Atmosphere | 0.001 | 0.04 | ~ 11 days | Precipitation |
| Rivers | 0.01 | 0.036 | Several weeks |
Flow into lakes; Percolate into groundwater; Drunk by animals; Evaporation |
| Biological Water (Plants & Animals) | 0.0001 | 0.003 | One week |
Plant transpiration; Animal respiration; Animal excretion |
Water Cycle Dice Game
This seemingly simple dice game illustrates the many processes that move water between its primary reservoirs and how long it remains there. Residence time is vital to consider when processes are affecting matter cycles. Ice can store water for hundreds of thousands of years. When polar climates warm and ice melts, it takes a long time by a human’s perspective for it to form again when the climate cools again. The poles experience some of the lowest annual precipitation totals on Earth, so it takes centuries to create ice sheets.
Note: The website for the water cycle dice game above is a valuable resource for teachers on how to introduce and run the activity in a classroom.

Make inexpensive dice for the water cycle activity using small cardboard boxes. Teacher Tip: store each set of dice separately; otherwise, chaos ensues the next time you use them.
Water Cycle Web App
The water cycle dice game provides an excellent introduction to how water moves through the various reservoirs. Still, one would need to play many, many rounds, keep track of the data manually, and then create graphs and statistics to see the connections between the rates and scales or the process moving water and the reservoirs. To make this easier, use the Water Cycle web app.
You may use it as the dice game by selecting one step/run or change it to see the impact of averaging many steps per run. You may run the model up to 50,000 steps before needing to reset the simulation.
Explore the eight visualizations of the data (examples of each follow). This supports changing one’s perspective to see new patterns and relationships. There is an introductory diagram of the water cycle, text describing the current location of the molecule and how it got there, diagrams based on the statistics of what has occurred to the water molecule up to that point, and a system view how the molecule has moved.
Click the button to simulate the water cycle processes. The following images are screenshots from the various visualizations of how a water molecule moves through the nine major water reservoirs.
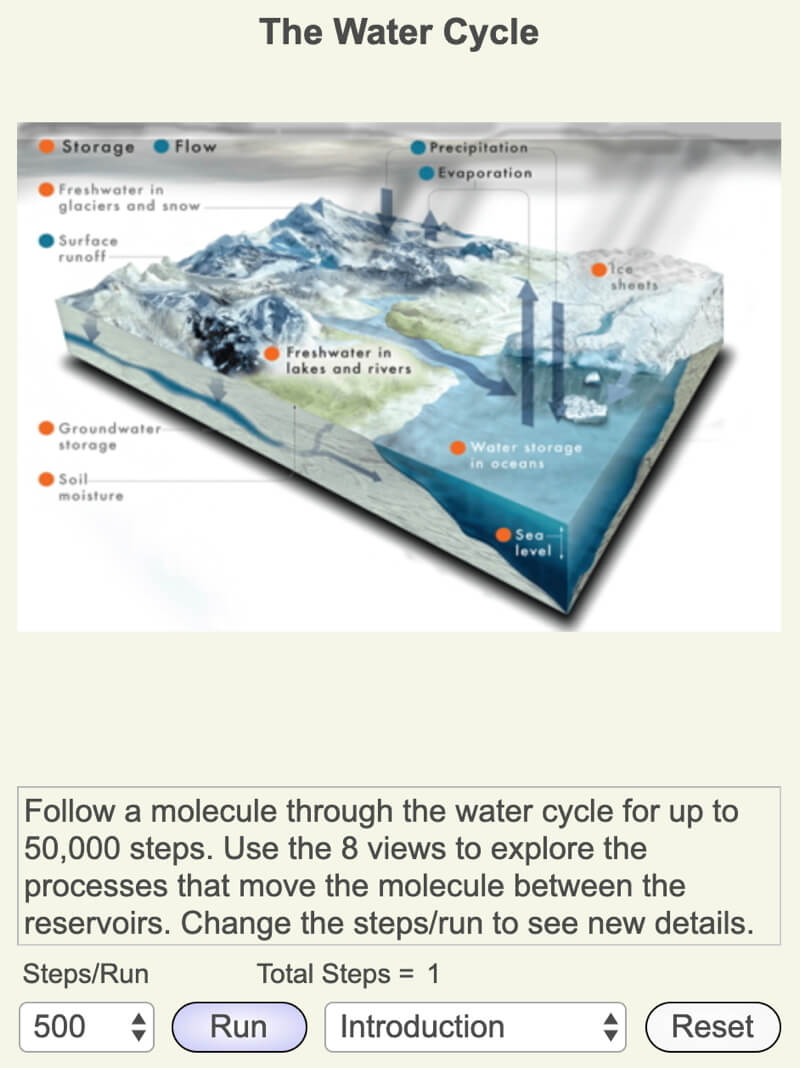
Screenshot of the introduction to the Water Cycle app.
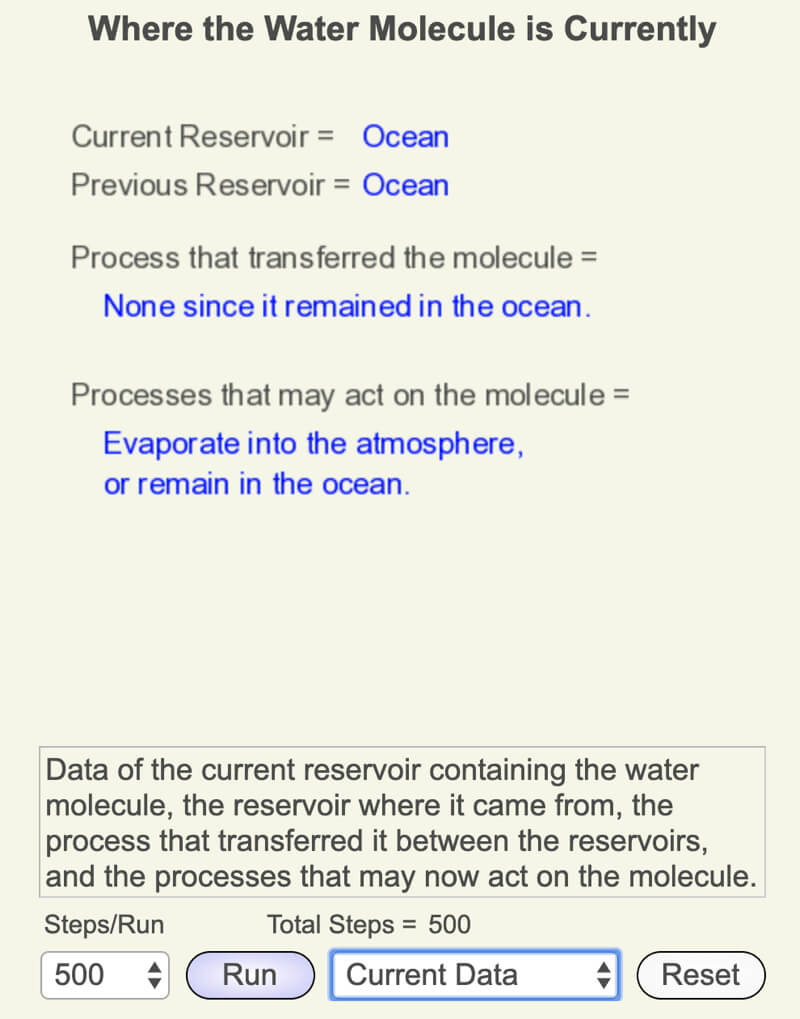
Text describing the current location of the water molecule in the water cycle, how it got there, and where it could go next.
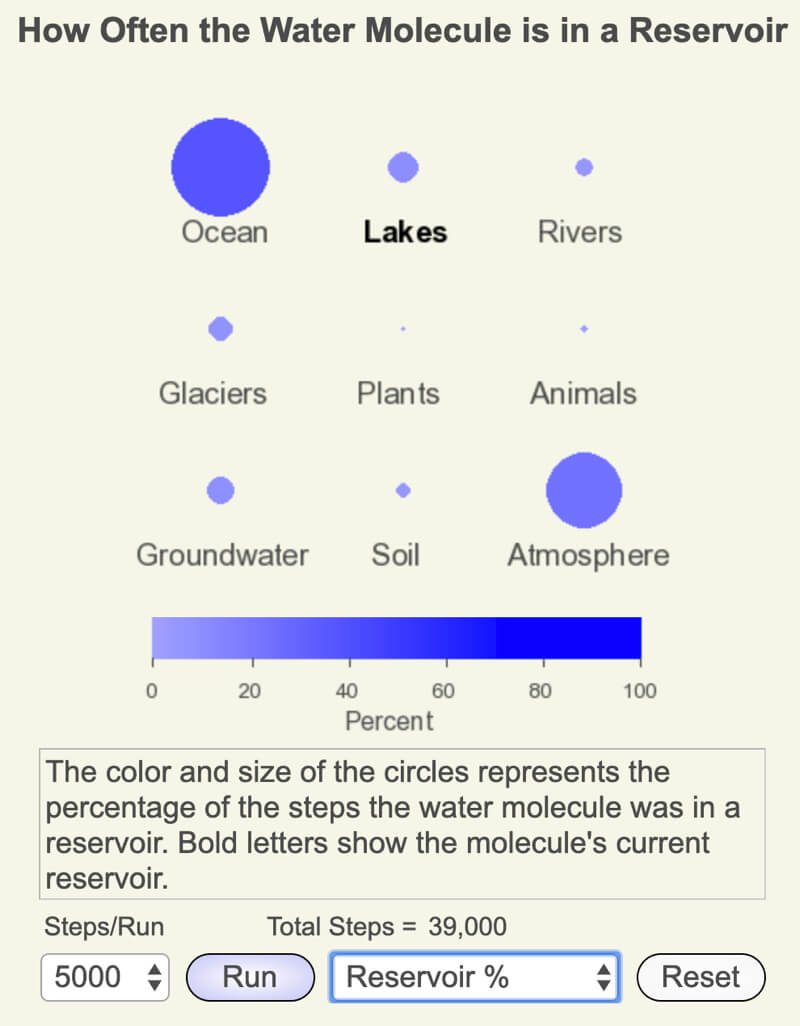
Visualization of the frequency the water molecule was stored in each reservoir.
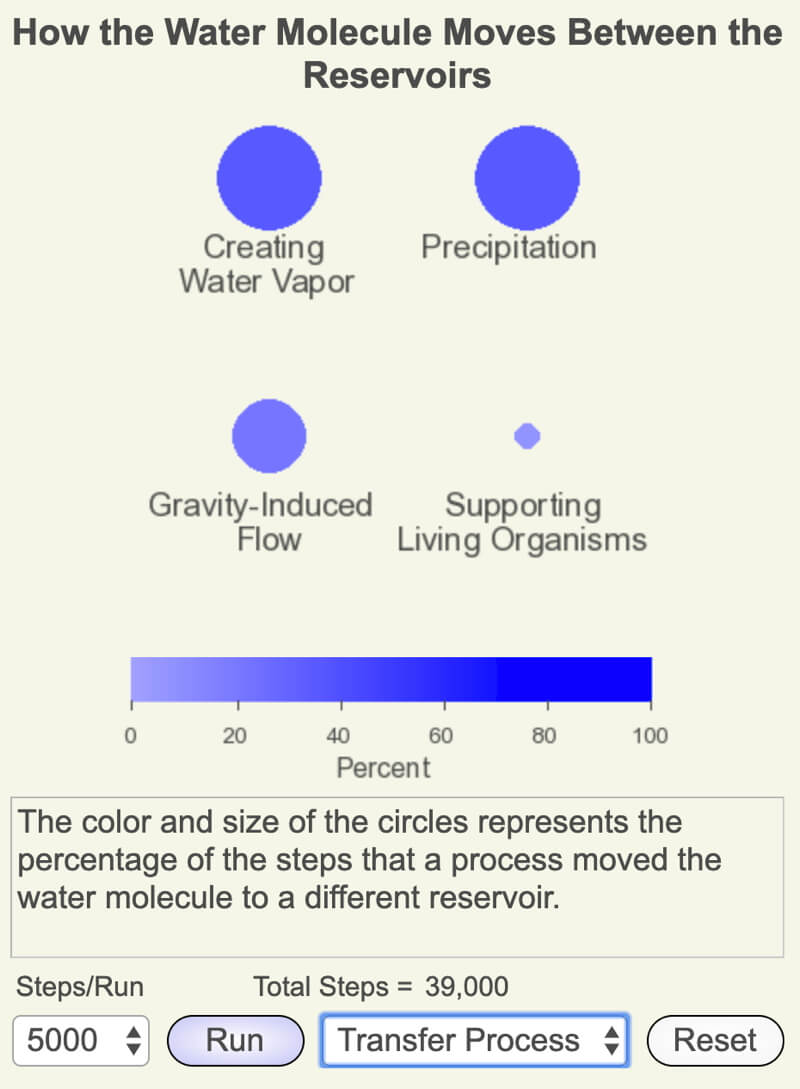
Visualization of the frequency of the processes moving water between reservoirs.
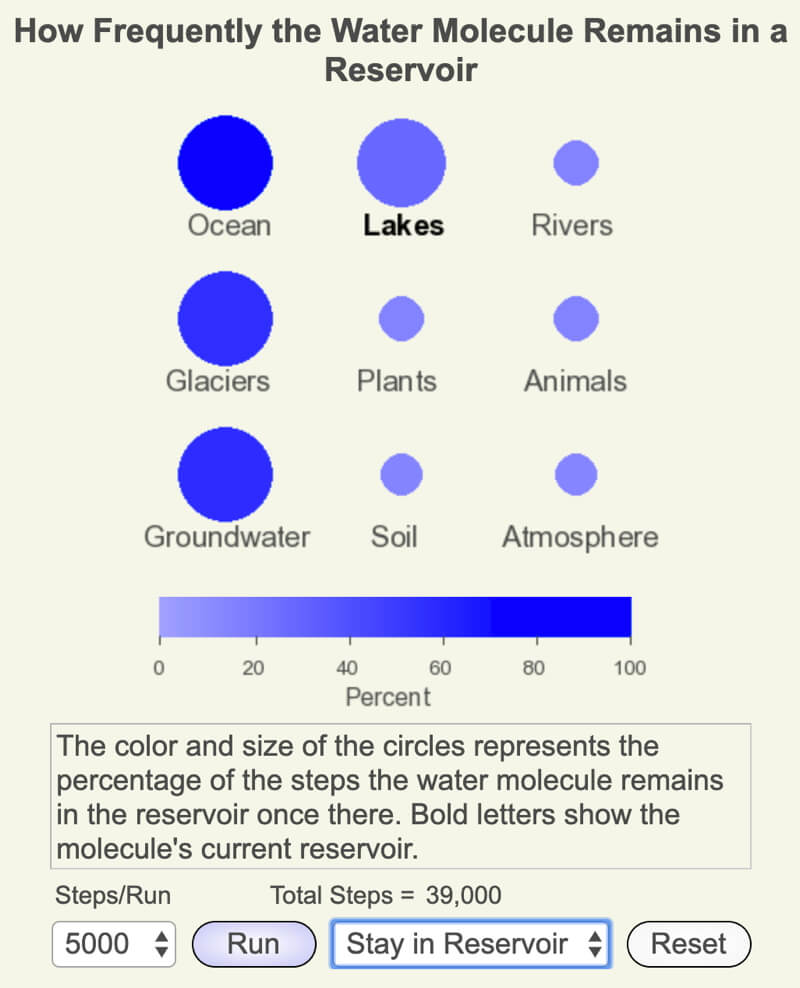
Visualization of how often the molecule remained in the reservoir once it entered.
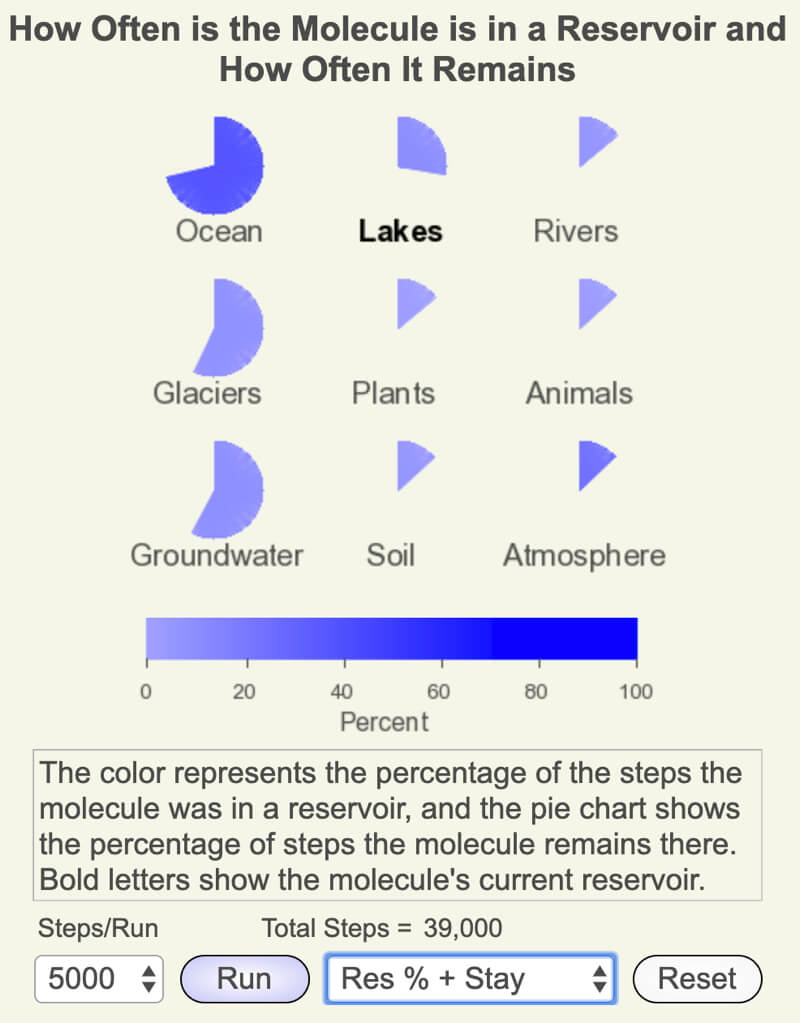
Visualization of the frequency the water molecule was stored in each reservoir and how often it remained once it arrived in the reservoir.
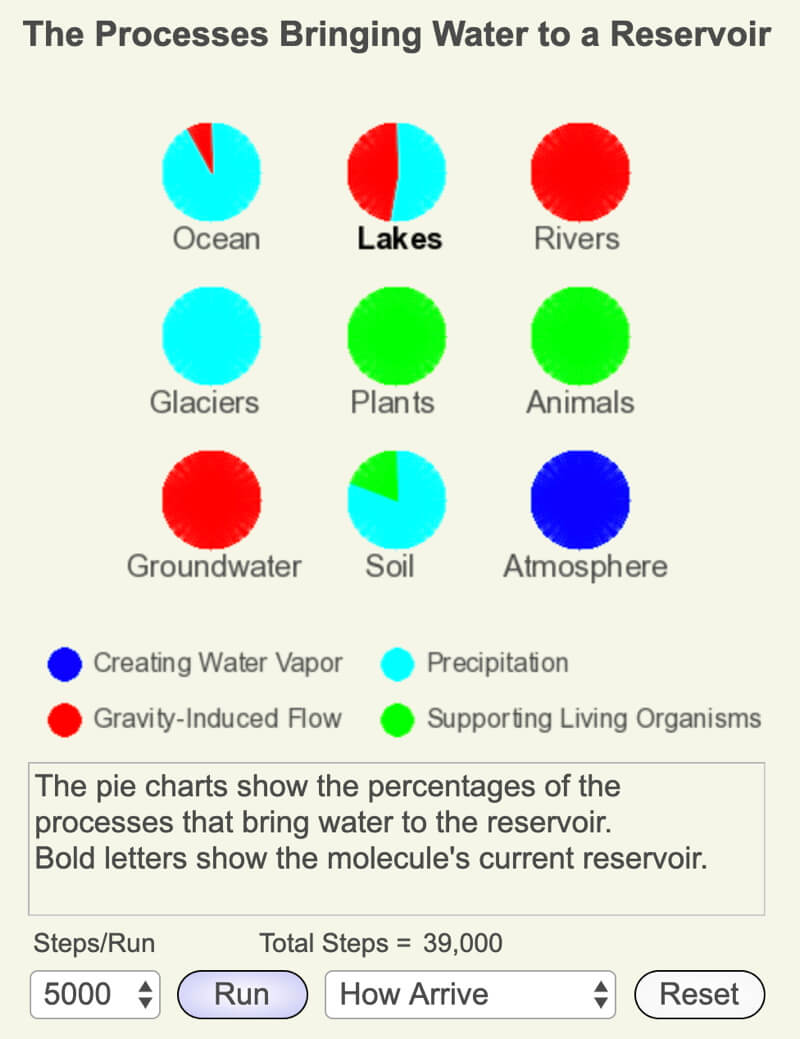
Visualization of the percentages of the processes that brought water into the reservoir.
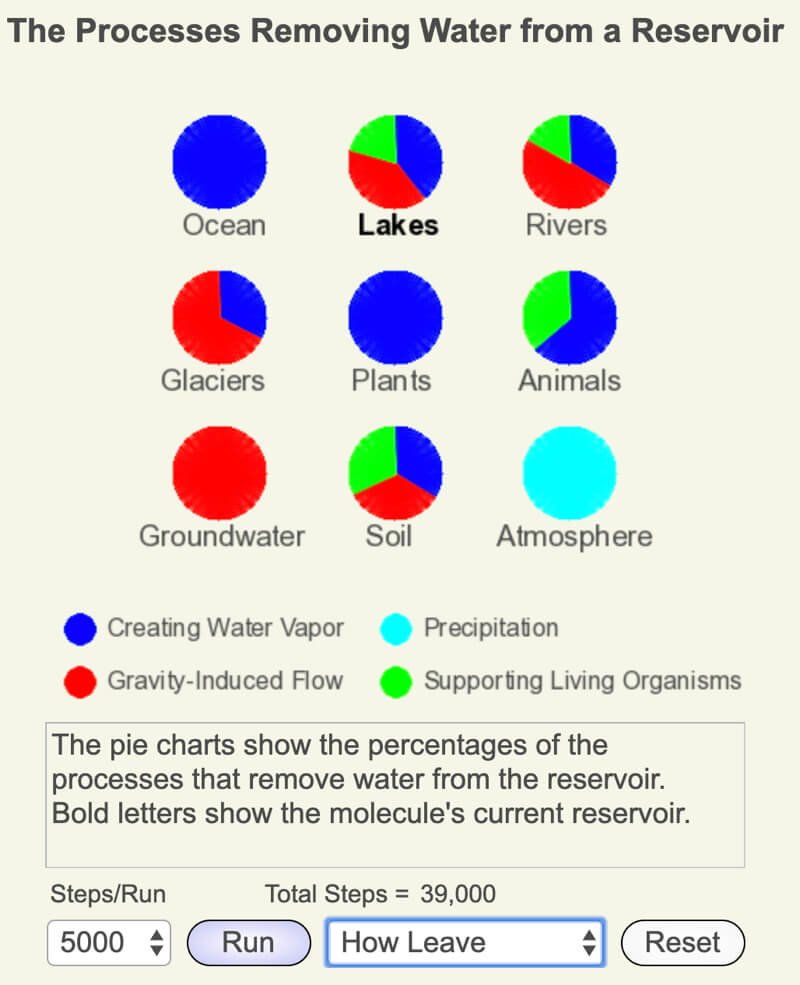
Visualization of the percentages of the processes that removed water from the reservoir.
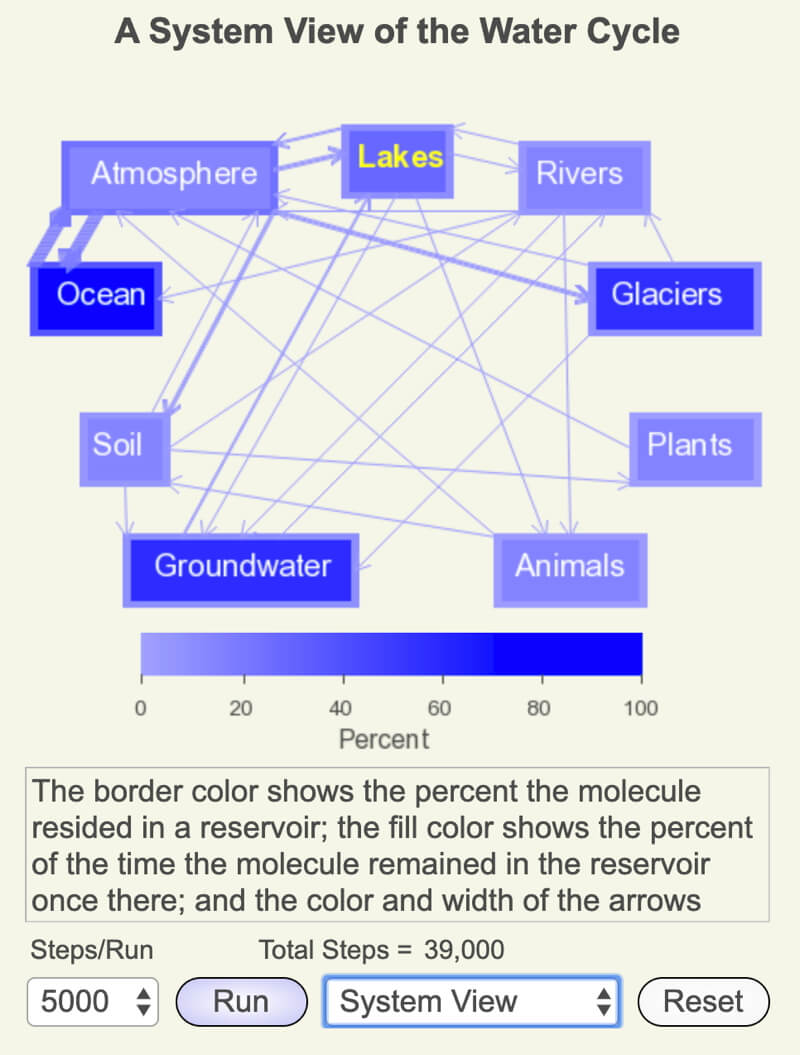
Visualization of the water cycle system in which the frequencies of a water molecule in a reservoir, how often it remained, and the rates of the processes that moved water between the reservoirs.
Water Cycle Model using Google Sheets
The water cycle dice game and app above is based on a random chain of dependencies, also called a Markov chain model. For example, a water molecule in the ocean has only two possible outcomes during the next cycle: remain in the ocean or evaporate into the atmosphere. Water molecules in the atmosphere have different possibilities: either remain in the air in the form of a cloud or precipitate onto glaciers, lakes, soil, or into the ocean. Once we identify the probabilities of how a molecule would move between the nine reservoirs, we can create a Markov chain model to study how water moves through the water cycle involving the nine largest reservoirs.
We need to identify the probability that the molecule moves to one of the other eight reservoirs or stays put for each reservoir. This means we create a 9×9 grid of probabilities, some of which indicate zero chance of water moving between two specific reservoirs. Ocean water has only two non-zero probabilities, and the remaining seven are zero since water can’t leave the ocean and go directly to these reservoirs.

For the 6-sided dice game, water in a reservoir is limited to only 6 possible options, and these responses are shown in the rows of the transition probabilities grid (shown above). There are only two possible outcomes for a given molecule of water in the ocean per cycle: evaporate or remain in the ocean. In this model, two-thirds of the time, the water remains in the ocean, 1/3 of the time the water evaporates, so the probabilities are 0.667 or 4/6 to remain in the ocean and 0.333 or 2/6 to evaporate. Note that for each reservoir, the row of transition probabilities must add to 1.
Open the model in Google Sheets, use the “Make a Copy” in the File Menu, and experiment with changing the transition probabilities to see how your model responds. Tip: the name of your file should include what experiment(s) you are trying. Since you can’t make changes to the file opened from the link, use it to get another copy of the original model when you need it.
How Good is this Model?
When the 6-sided dice Markov chain model of the water cycle is run, the water distributes into a steady-state, so a good way to check the model’s validity is to compare to the amount of water in each of the reservoirs shown near the top of this page. This version captures a rough ranking of the largest to smallest reservoirs, but it is quite different from the water distribution on Earth’s surface today.

What happens if you use dice with more sides? Use an n-sided dice version (the current version uses 200 sides, but you may change it to any number you like). Use the present-day water distribution in our reservoirs to find the best number of opportunities water may change between reservoirs.

Suggested Experiments
- Does it make a difference how the water is initially distributed in the reservoirs? The model available on the website has all of the water starting in the atmosphere, which may have been how the water was distributed on a very hot Earth shortly after it formed.
- What was the water cycle like before plants and animals evolved?
- How does the water cycle change when the Earth is too warm for glaciers?
- How are humans impacting the global water cycle?
Open the n-sided dice model of the water cycle to see a version of experiments 1-3. See if you can improve upon them! Use the data that follows to begin exploring the human impact on the water cycle.
As you have seen above, these models are not perfect, but they allow for testing ideas of understanding the interconnected processes involved in the water cycle. Creating your own experiments and discussing why you arrived at the transition probabilities you did are invaluable learning experiences. If possible, try to create your experiments in small groups to discuss your ideas to arrive at your probabilities.
Acknowledgments
Matti Horne’s keen attention to detail and creative ideas improved these models greatly.
Human Impact on the Water Cycle
Like most living organisms, humans need water to support their cell’s many functions that keep them alive. But humans also use water in food production, transportation, many of our technologies, recreation, and even a repository of our waste. Humans use water on such a large scale that scientists are now examining how the ‘human water cycle‘ impacts the natural water cycle.
To meet our growing demand for water for humans:
- Currently using nearly 50,000 dams to create hydroelectric power. These disrupt rivers, create artificial and temporary lakes, and alter groundwater exchange.
- Altered landscapes to create homes, industrial buildings, and transportation infrastructure that alter runoff from the soil, groundwater recharge, and river and lake inflow.
- Removed forests and created agricultural fields that have changed transpiration rates.
- Polluted our oceans, rivers, lakes, soils, and groundwater, making it difficult for many to acquire clean water for drinking.
- Human-induced climate change is altering evaporation and precipitation rates globally, changing the natural distribution patterns on Earth.
Use the concept map above to predict how a change in any of the reservoirs or processes moving water between reservoirs would impact the water cycle.
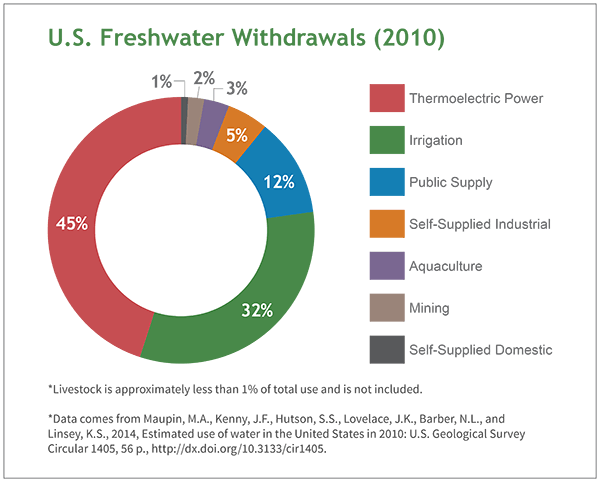
How Americans use water commercially and institutionally. Data from EPA’s Water Sense webpages. Visit for more information on how we use water.
0 Comments