Solar Time, Angle, and Direction
Declination circles help us visualize how the Sun moves about a given location on Earth’s surface during 24 hours. A declination circle tracks the apparent 24-hour path of the Sun around location on the surface of the rotating Earth, so we are viewing a circular path mapped onto a sphere with a radius of roughly 93 million miles. Another way to think about a declination circle is that it represents a continuous path of Sun positions.
The Sun’s Position in the Local Sky
The sun angle and direction to the local horizon define the Sun’s position in the local sky, which is the sky viewed from a given location on Earth. A declination circle represents the continuous position during a 24-hour period. You can draw a declination circle when you know these two factors:
-
- The date, which depends on the place in Earth’s orbit around the Sun and creates the daily solar declination, and
- The latitude, which determines the orientation of the local horizon to Earth’s axis of rotation, and
The time of day, which is a measure of the orientation of the local horizon to the Sun, locates where the Sun will be on the declination circle, which is also defined by sun angle and direction.
To predict and use the position of the Sun in the sky (for example, navigation, design buildings, design and install the most efficient solar technologies, etc.), we need a solid conceptual understanding of each of these components, which is where declination circles provide a visualization of the interrelationships of the five variables:
-
- Date,
- Latitude,
- Solar time,
- Sun angle, and
- Sun direction.

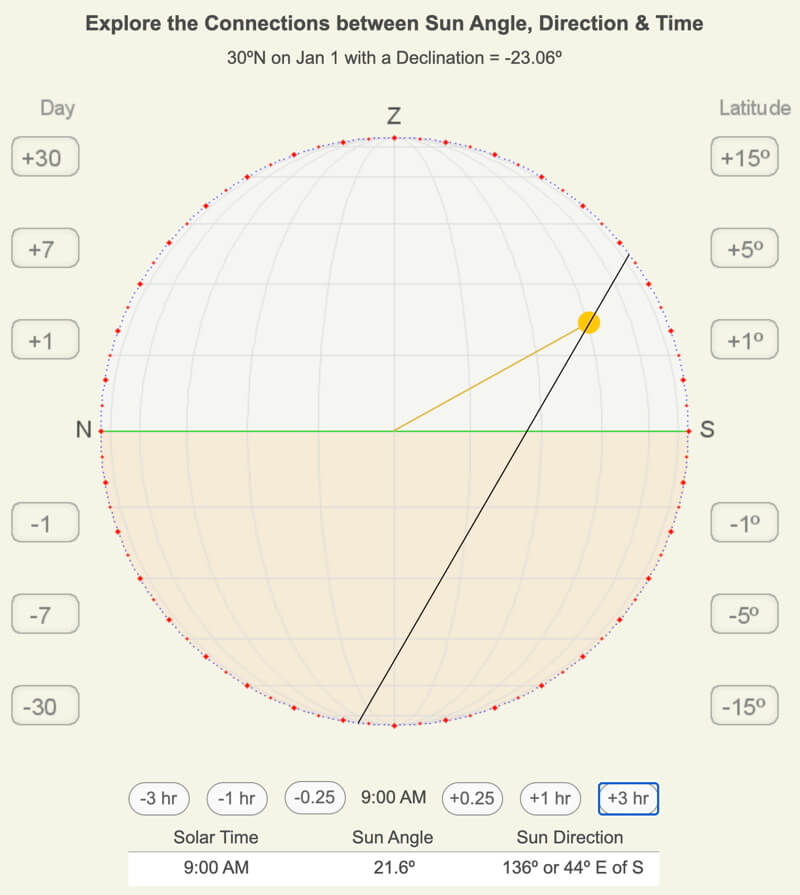
Above is a screenshot from the Sun Angle and Direction web app. The link to the app follows.
The Sun’s apparent path across the sky (light blue area) for 30ºN on January 1 is drawn in black. The angle above and below the horizon (light green line) are shown with the horizontal gray lines, and the direction are shown with the gray vertical arcs. The position of the Sun and the orientation of the incoming sunbeam at 9 AM are orange.
Sun Angle and Direction web app
Although earlier web apps explored one or two aspects of declination circles, this is the first app in which the five declination circle variables are explored more precisely to see how they interrelate with each other: date, latitude, solar time, and sun angle and direction. Select the date and latitude to create a declination circle, then change the solar time to see the Sun’s position in the local sky, either with the angle and direction grid lines or with numerical output.
Several visualizations are available to help view what a location experiences throughout the day and year.
Click the button to run the Sun Angle and Direction web app for desktops, laptops, and tablets.
Acknowledgments
Many thanks to Matti Horne for her insightful suggestions and insights during beta testing.
Visualizations
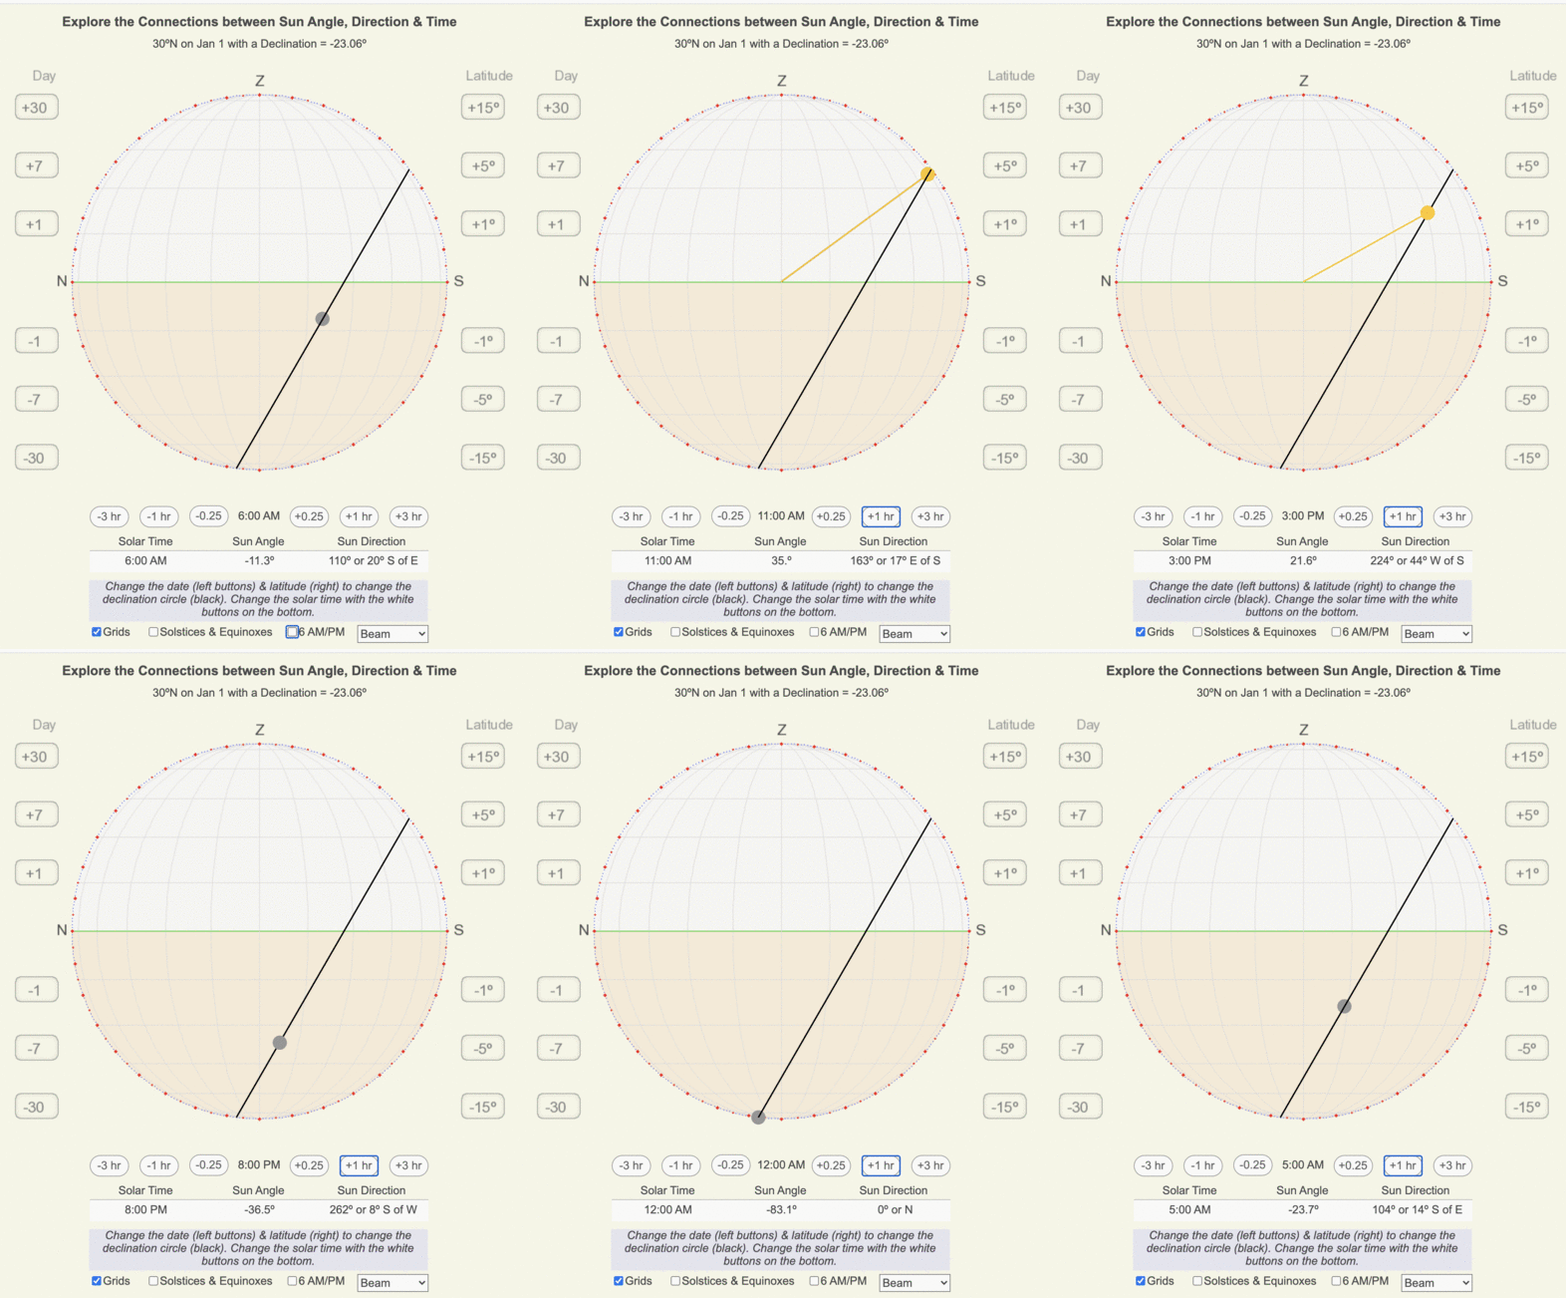
- The Sun’s location on the declination circle for the selected solar time is shown as gray when below the horizon and orange when above. During the morning hours, between midnight to noon, the declination circle is drawn through the Sun since it appears in the eastern hemisphere of the local sky. The western portion of the declination circle is visible. Between noon and midnight, the Sun is within the western half of the horizon, so the eastern part of the declination circle is behind the Sun.
- Sun angle and direction grids are drawn every 15º.
- View the declination circles for the solstices and equinoxes, which quickly show the range of the astronomical seasons.
- 6 AM/PM positions throughout the year help visualize the midpoint of the declination circles so you can estimate the hours of daylight on any day of the year.
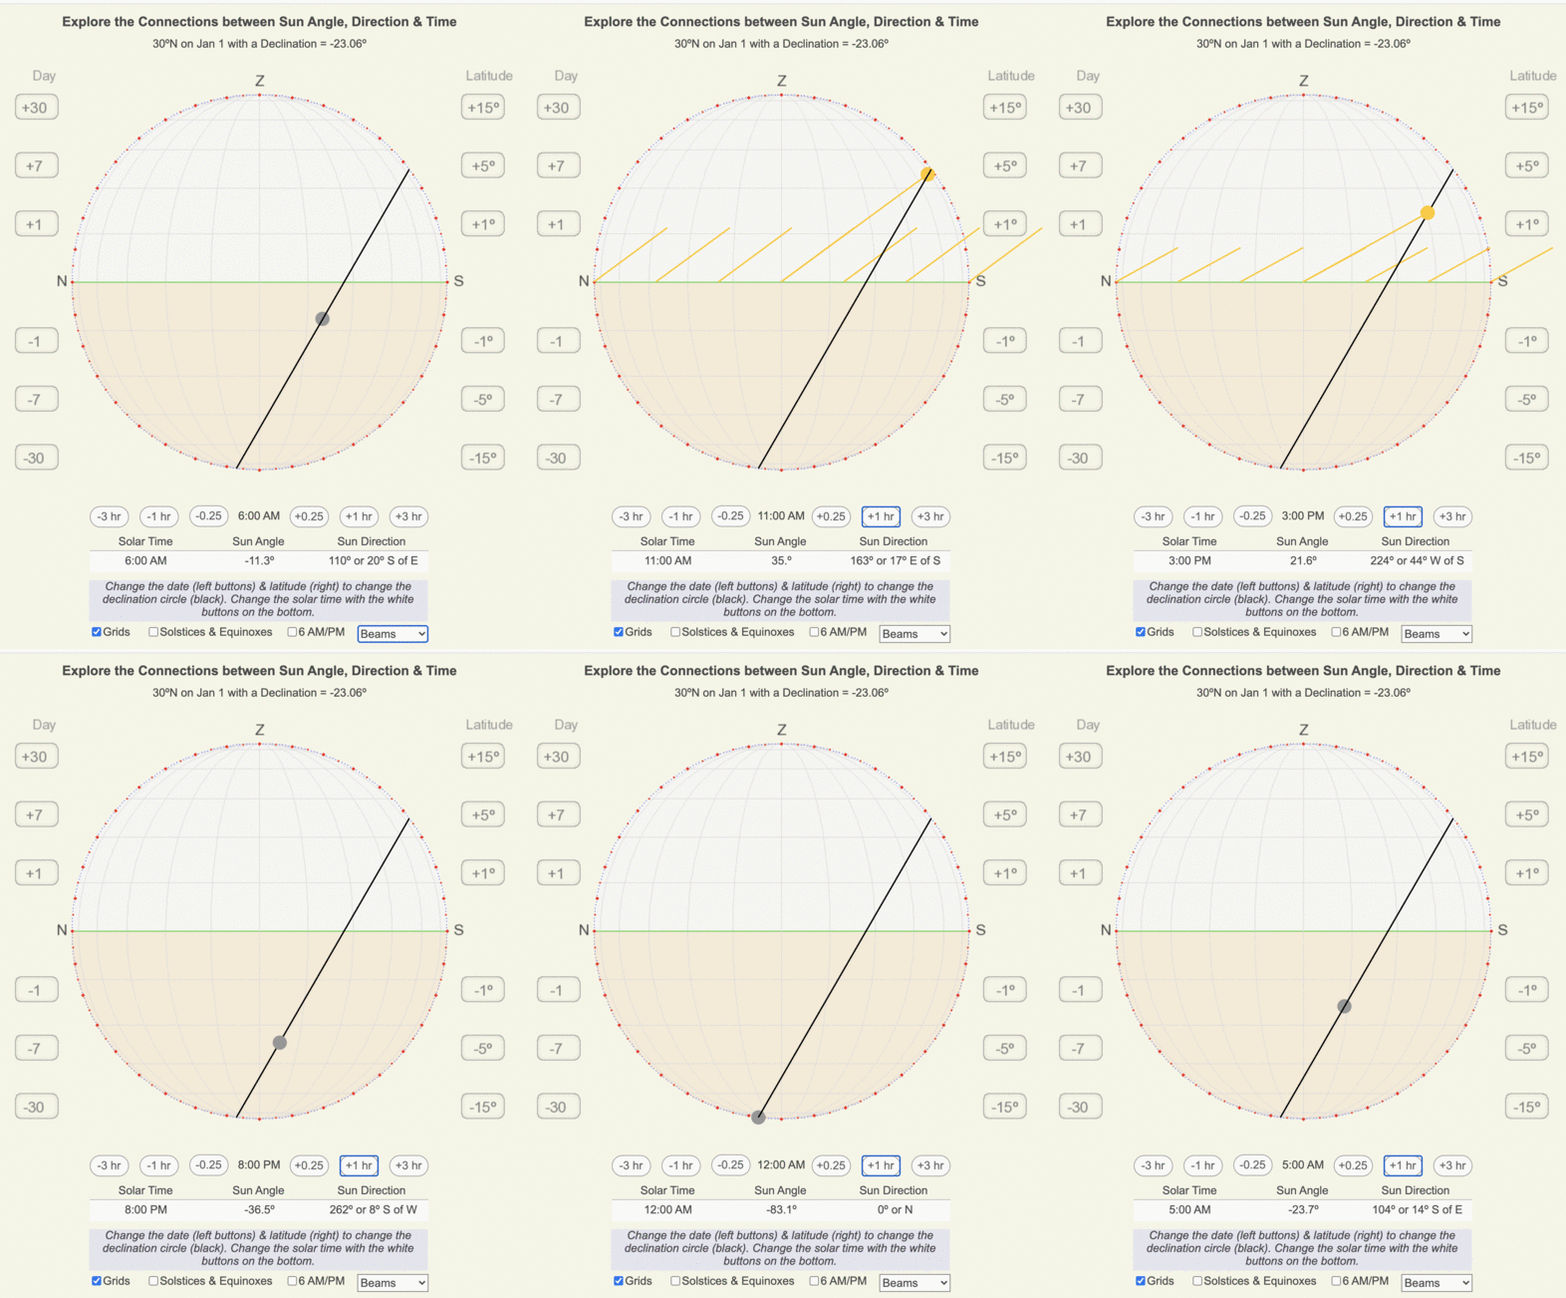
- See the adjacent animations to explore the visualizations of a sunbeam and sunbeams.

The first visualization of a sunbeam hitting the center of the local horizon when the sun is above the horizon shows what we experience at a given location as the sun moves throughout the day.

The second visualization shows several sunbeams hitting the horizon. Since the Sun is 93 million miles away, the sunbeams that reach Earth are parallel, so the Sun’s orientation remains constant as we move about short distances within our horizon.
Mathematical Relationships
Mathematically, the function of the daily path of the Sun is equal to the function of the Sun’s current position in the sky:
Daily Path of the Sun(day, latitude, solar time) <=> Current Sun Position(angle, time)
There are five mathematically interconnected variables. If four are known, we can calculate the fifth by manipulating the formulas or drawing declination circles. Remember, some events carry an implicit understanding of time or sun angle:
-
- Sunrise or sunset: sun angle is 0°, so if we know the direction, we have a defined position in the sky.
- Local noon and midnight: we know the solar time and the three options for the Sun’s direction (north, south, or overhead).
Finally, there is a connection between longitude, solar time, and clock time. You can calculate your longitude if you know the clock time of the local clock time and that at the Prime Meridian (0°). Safe navigation by mariners required accurate timekeeping on ships to calculate their longitude. For a fascinating book about the invention of the chronometer, see Dava Sobel’s book, Longitude.
Aside: When I learned about this technique to draw declination circles with a ruler and protractor in the mid-1980s, I felt like I was given the keys to understanding and applying one of the foundational concepts of meteorology and all Earth systems (which hadn’t become a common term yet!). Even though I could apply the trigonometric equations to calculate the Sun’s position, they are not easy equations to calculate or even estimate in your head. Declination circles provide a mental model for me to apply at any location and time of year quickly. I can visualize the important patterns and relationships to estimate and calculate the variables I am interested in.
Interestingly, in creating the web apps in the Sun-Earth Connection, I recreated the trigonometric equations through the geometry of the circles, angles, sectors, and chords that needed to be drawn.
Big Ideas
- Observed trends in the durations of twilights:
- Higher latitudes have a larger seasonal change in the duration of twilights (and sunrises/sunsets) than tropical latitudes,
- The longest twilights occur near the summer solstice (the summer solstice for the Northern Hemisphere is June 21 and December 21 for the Southern Hemisphere), and
- The shortest twilights occur closest to 6 AM/PM, which happens near the equinoxes.
Click on the following toggles to view descriptions and links of the web pages on each topic of the Sun-Earth Connection.
Sun-Earth Connection overview
An overview of how the Sun’s energy is generated and how its thermal radiation illuminates and heats Earth.
Earth Illumination Patterns
- Overview: The Sun illuminates the spherical, rotating planets orbiting it.
- Obliquity and Earth’s Illumination: Obliquity is the angle between the planes of the Earth’s equator and its orbit around the Sun.
- Declination, Latitude, & Earth Illumination: Solar declination is the angle between the Sun’s rays and the plane of the Earth’s Equator. Its value depends on where Earth is in its orbit around the Sun.
- Astronomical Seasons & Illumination: Astronomical seasons are based on the orientation of Earth’s axis of rotation to the Sun, which determines the amount of illumination between the Northern and Southern Hemispheres.
Distribution of the Sun's Energy on Earth
- Overview: Even though an area is illuminated by sunlight, there can be quite a range of energy interacting with the surface.
- Sun Angle and Beam Concentration: If every beam of sunlight reaching Earth has the same amount of energy, why do some areas warm up more than others?
- Diurnal Heating: Diurnal heating is the temperature change over 24 hours. When sunlight shines on the ground, it warms. Two critical factors that determine the amount of heating deal with the Sun’s illumination.
- Seasons: Earth experiences astronomical seasons due to its obliquity.
- Climate Regimes: Climate regimes are an extension of diurnal heating and seasons, but the time frame is now years.
Declination Circles: A tool to analyze the Sun's position in the sky.
- Overview: Drawings of declination circles contain the visual and numerical information to understand and predict the Sun’s motion across the sky.
- Declination Circles 101: Draw a declination circle with just a ruler and protractor/compass to quickly and accurately know the Sun’s position in the sky at any day and time of the year for any location on Earth.
- Drawing Declination Circles: Declination circles are quite easy to draw by hand.
- Interpreting Time on Declination Circles: Accurately estimate the time of day using the Sun’s location in the sky.
- Sunrise, Sunset, & Twilight: Calculate the timing and duration when the Sun is at or near the horizon.
- Solar Time, Angle, & Position: The sun’s angle and direction to the local horizon define the Sun’s position in the local sky. Explore how to use declination circles to calculate the Sun’s position at any solar time anywhere in the world on any day of the year.
- Changing Views of Declination Circles: Use the web app View Declination Circles to explore three common views of declination circles to identify their strengths, limitations, and applications. Then learn how to go from one view to another.
- Using Declination Circles: Humans have been using the apparent motion of the Sun as a compass, clock, and calendar for millennia.
- Using Sundials: Humans have been using the Sun’s position to navigate and tell the time, day, and season for millennia. Sundials create shadows that make it easier to do these tasks.

0 Comments