Atmospheric Convection and the Ideal Gas Law
Click the button to run the web app, Convection. Supporting information and a second button for the app are below.
Atmospheric Convection
Convection is the rising and sinking of a fluid (a phase of matter that flows, such as liquid, gas, or plasma) with a different density than the surrounding material. If a fluid is rising, it is less dense than its surroundings, and, conversely, a fluid that sinks is denser than its neighbors. For activities that explore the basics of convection, see Advection and Convection in the Energy section.
Atmospheric convection is the rising and sinking of gas (air) in our atmosphere. As we have seen on the previous page, Air Parcels and the Ideal Gas Law, it helps to deal with the rising and sinking of air parcels rather than individual molecules. The web app, Convection, available below, explores how 11 air parcels, drawn as squares, convect (or redistribute vertically) when the air parcel at the surface is heated. In the adjacent animation, the starting environmental temperature profiles, or lapse rates, are shown on the left graph. The parcels’ starting positions are shown on the right panel of the animation using the rainbow colors.
A temperature inversion is when the lapse rate increases with height, so cold air is beneath warm air.
Warm Air beneath Colder Air?
If the air parcels are not moving vertically, then the gas is stratified by density: the denser parcels are below the less dense parcels. Interestingly, the air parcels in each of the starting temperature profiles used in the Convection web app are not moving vertically since denser air parcels are below less dense parcels. This means there can be colder air parcels above warmer ones, yet there isn’t any convection!
The key is that air parcels change temperature as they respond to a change in pressure as they move vertically. We use the Ideal Gas Law to calculate how much the density, volume, and temperature change as parcels rise and sink.
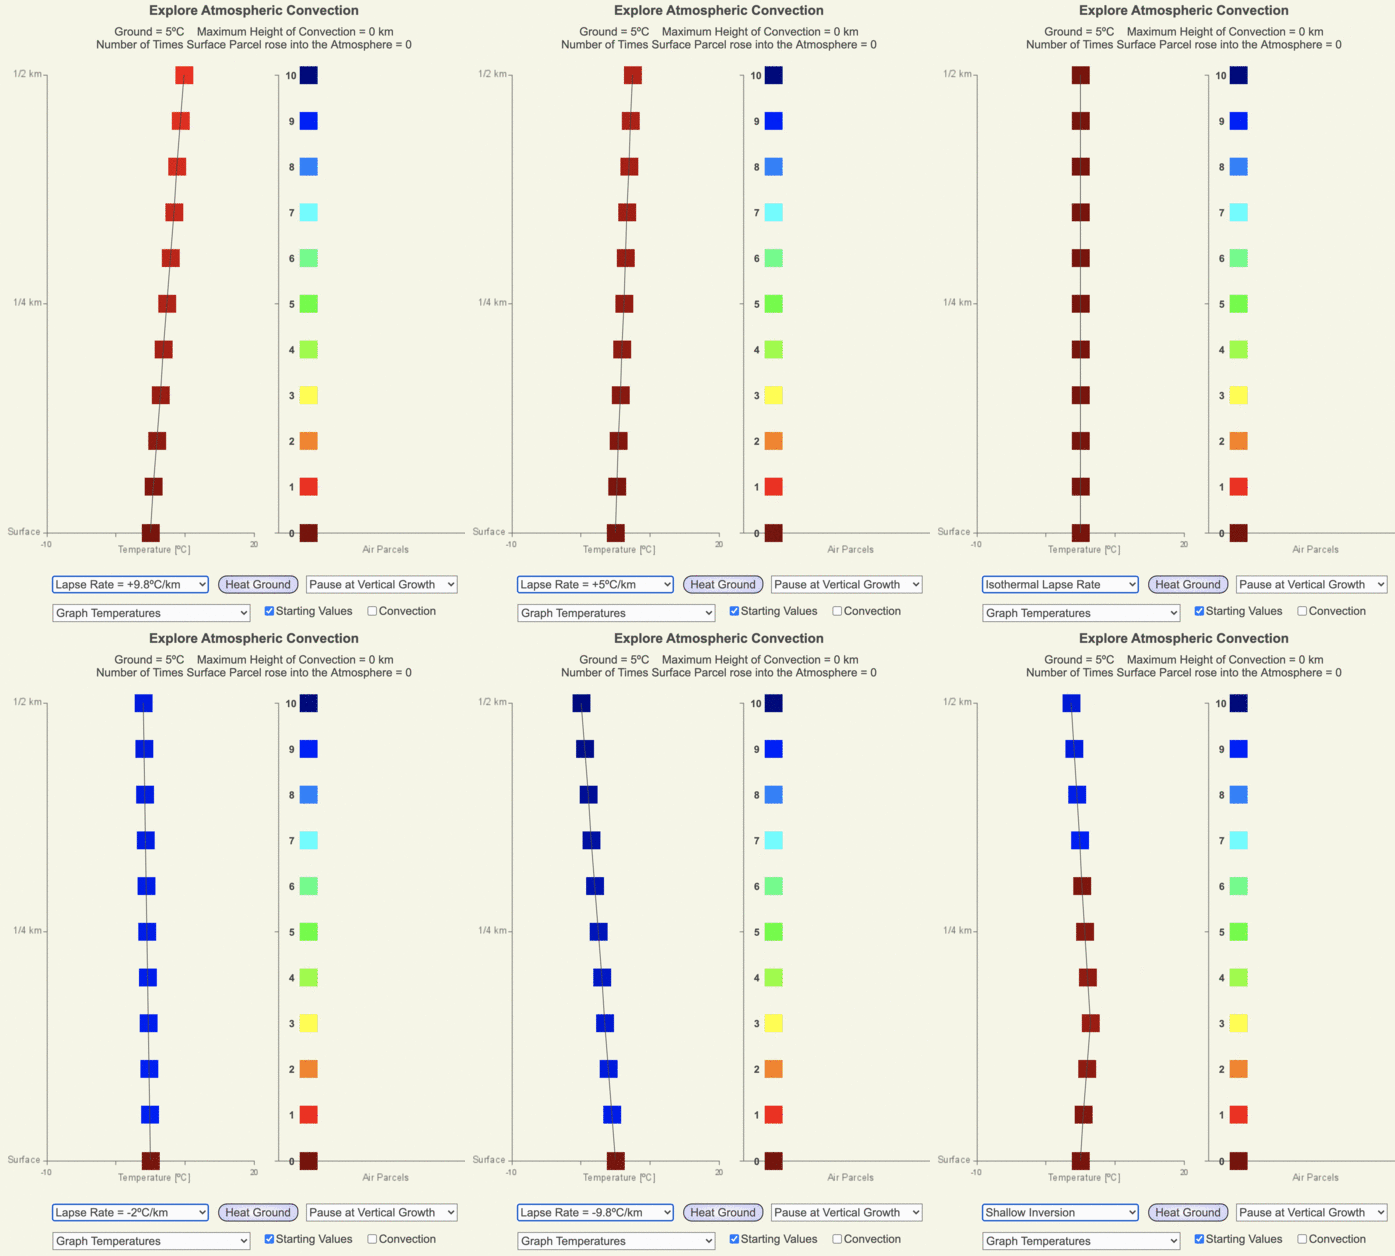
Animation of the starting vertical profiles of air parcel temperatures and starting positions from the web app, Convection. To help visualize the iterative process of atmospheric convection, parcels are drawn as distinct boxes.
Potential Temperature and the Ideal Gas Law
As we saw on the previous page, rising air expands and cools, and their net effect decreases the air parcel’s density. When an air parcel’s energy and molecules are not mixed with neighboring parcels, a rising parcel cools at -9.8ºC/km, known as the adiabatic lapse rate. Conversely, a sinking air parcel warms at +9.8ºC/km. To compare the density of a rising air parcel to its new surroundings, there is quite a bit of math to keep track of, so meteorologists created a variable that is much easier to apply to rising and sinking air parcels: potential temperature, which is the temperature of an air parcel when moved adiabatically to a standard pressure in the atmosphere, 1000 mb (which is about 364 ft or 111 m above average sea level pressure). Since an air parcel’s potential temperature does not change as it changes elevation, we may quickly compare which parcel would be warmer or cooler, and hence denser, when they are at the same height in the atmosphere. This assumes that all of the air parcels have the same percentages of gases and that water vapor did not condense or evaporate within the parcel as it moved vertically.
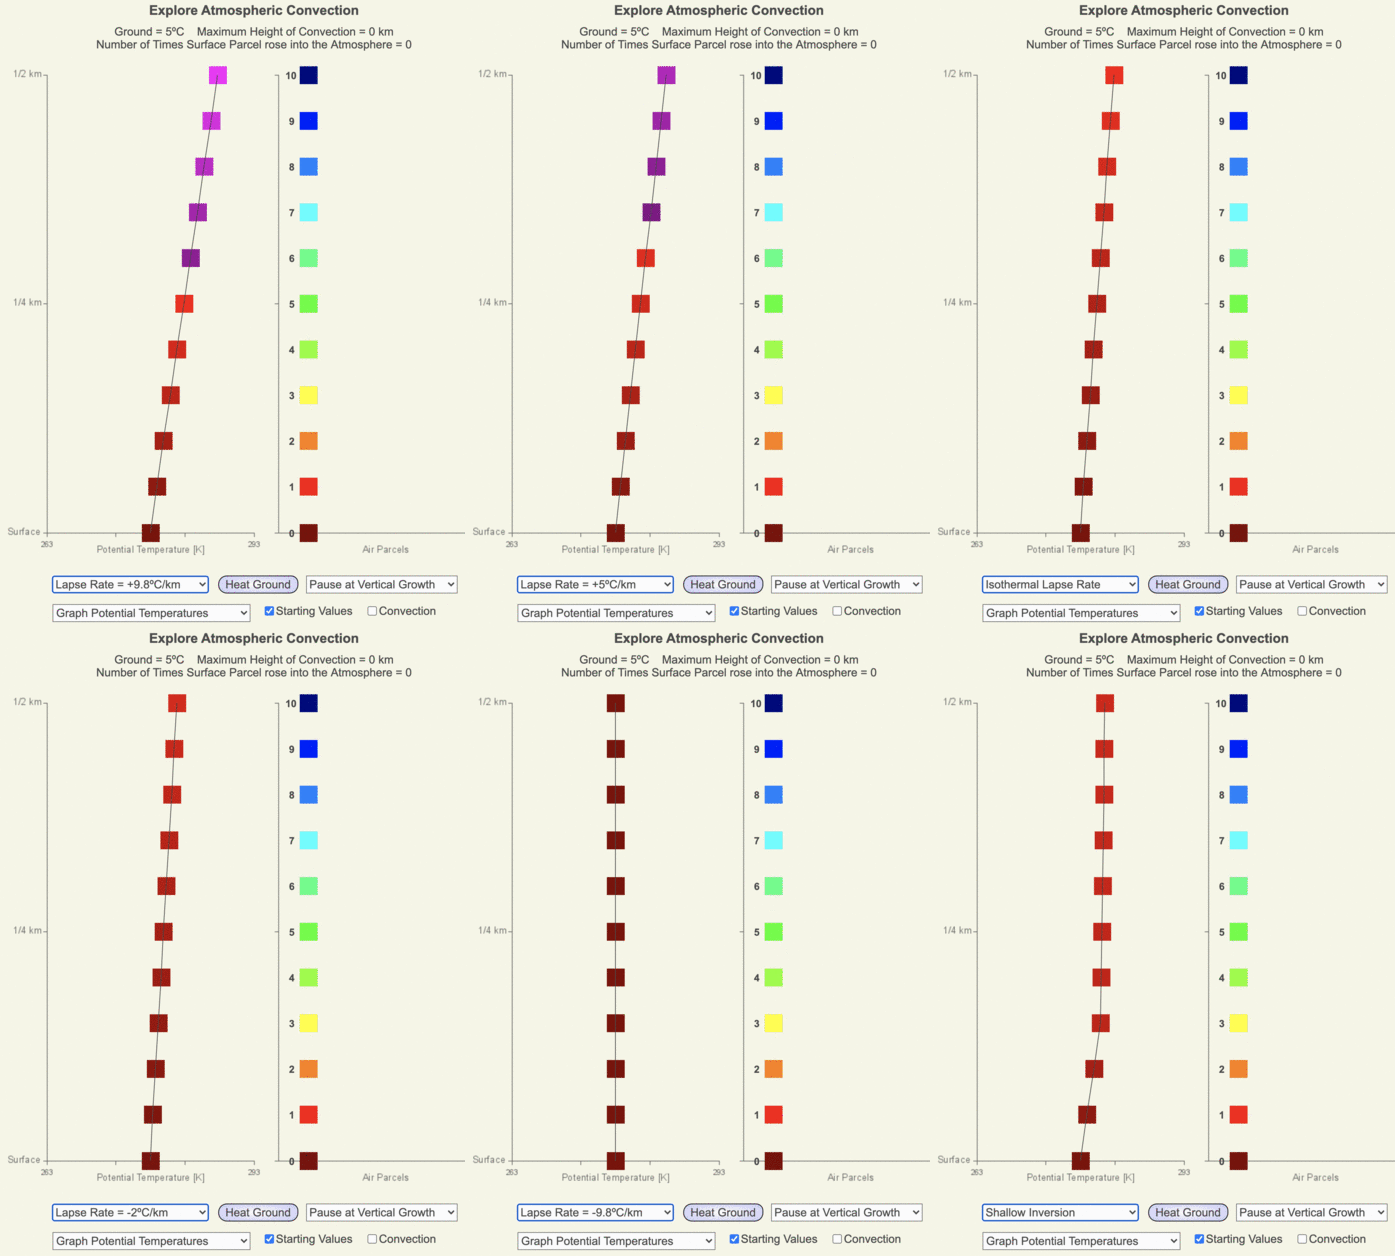
Animation of the same starting temperature profiles as shown above, but now we are viewing the air parcel’s potential temperatures. Notice that the parcels with lower potential temperatures are always below parcels with higher potential temperatures.
So What Makes Air Convect?
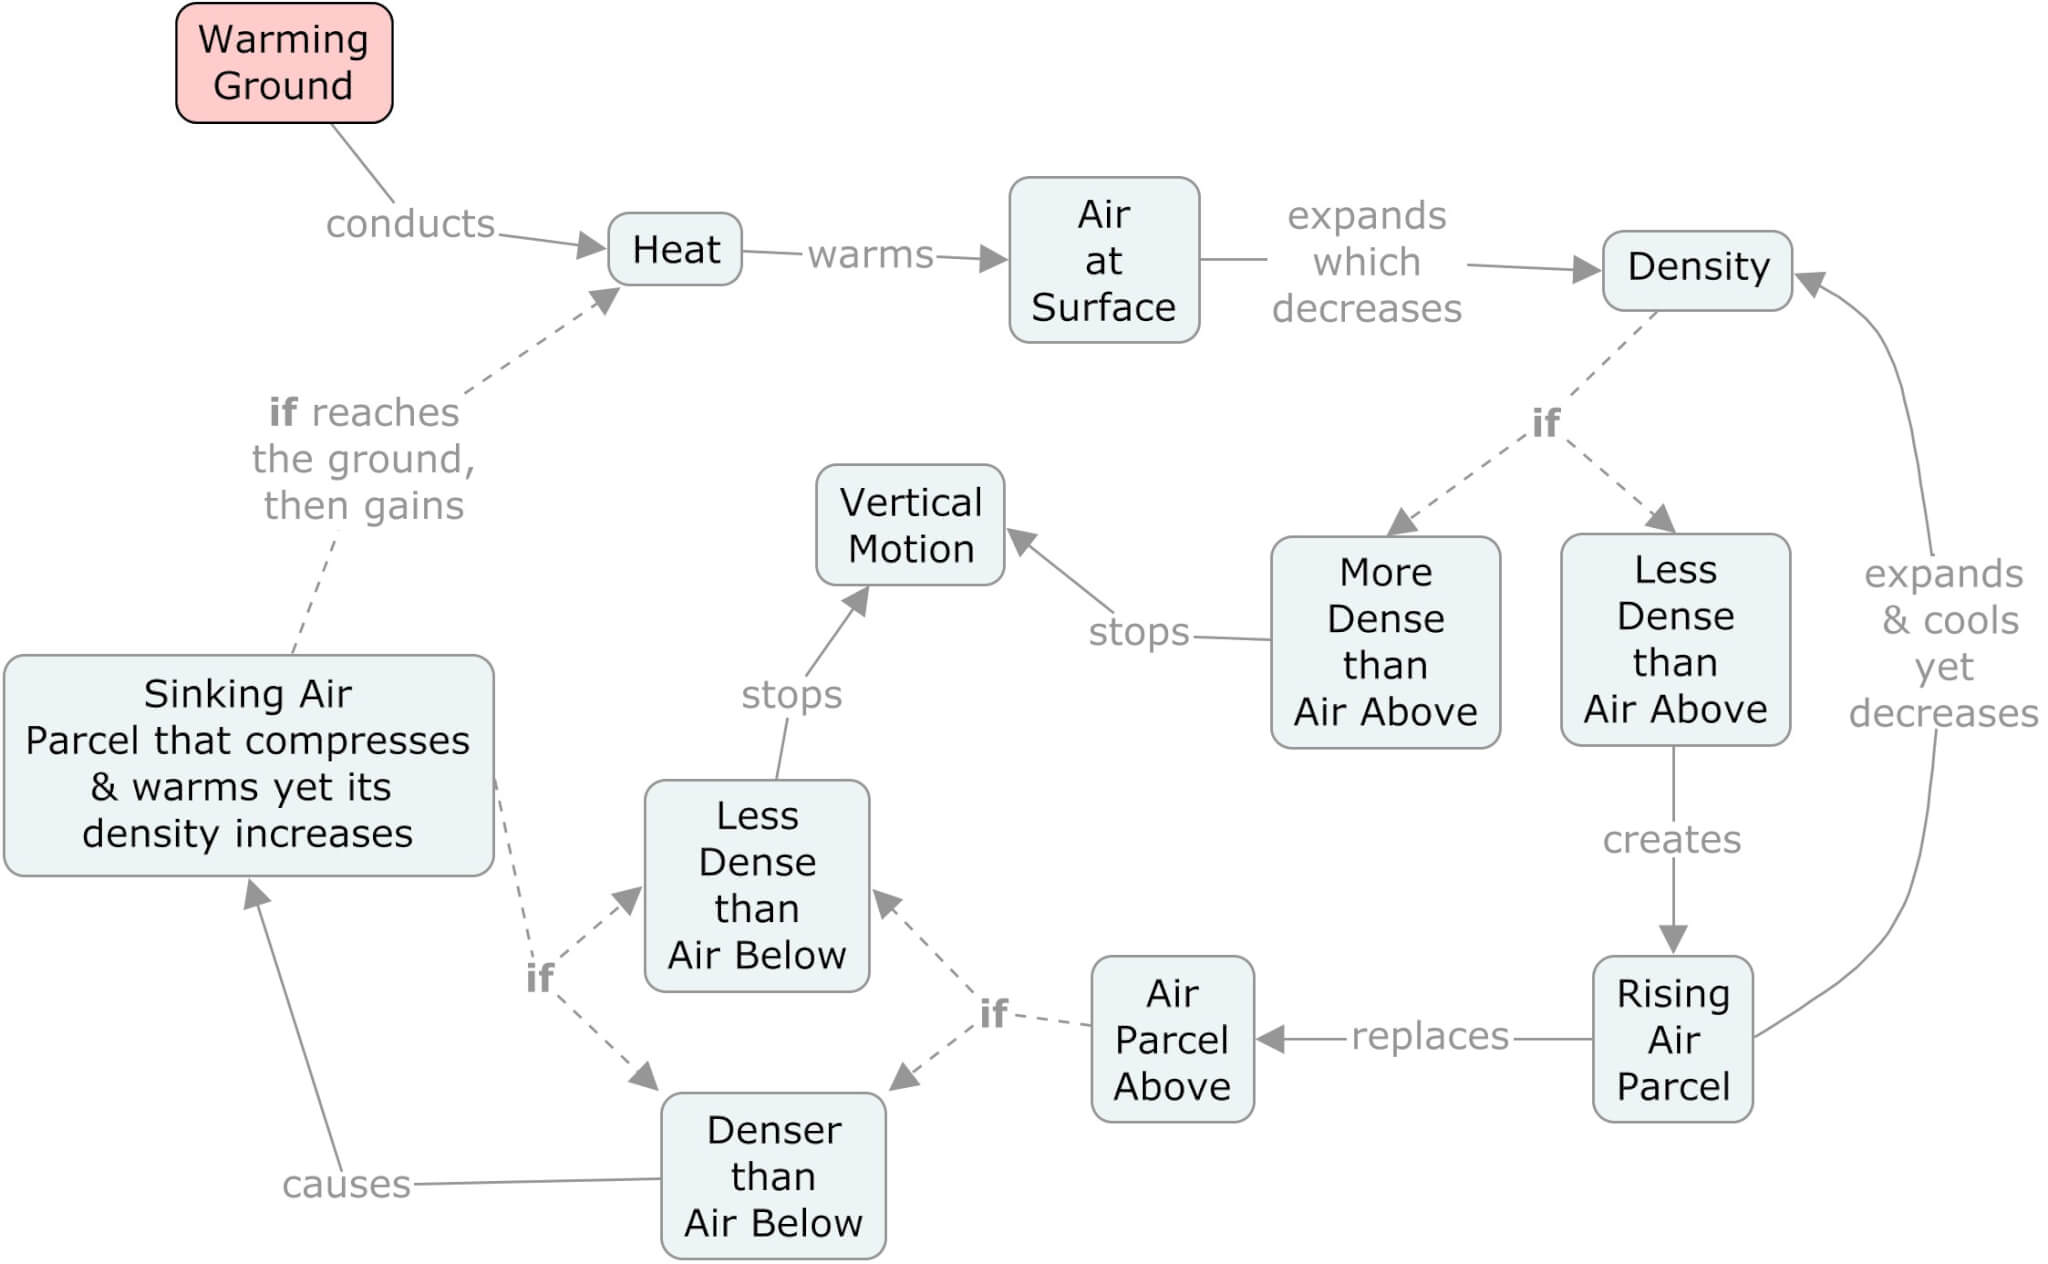
So what makes gases rise? In the following simulation, Convection, the ground is heated as it does each day on Earth (see Variables Affected Diurnal Heating). Then, primarily through conduction, the air parcel at the ground’s surface is warmed, causing it to expand and its density to decrease. Once the surface air parcel becomes less dense than the parcel directly above it, it rises, and the parcel above sinks. When there is rising air, there must be sinking air, and convection cells form. The iterative process of rising and sinking air driven by surface heating is outlined in the adjacent concept map.
There are other mechanisms that cause air to rise in the atmosphere, and these are explored in Clouds in Nature.
Explore with the Simulation, Convection
Click the button to run the web app, Convection.
The Convection web app has:
- 8 starting temperature profiles.
- 2 options for heating the ground:
- Pause after the convection cell grows vertically (useful when studying the variables that affect convection).
- Warm the ground at a specific temperature increment (good for learning how to predict the resulting growth and depth of convection).
- Turn the display of supporting data on and off to focus on the atmosphere’s convection and heating behaviors.
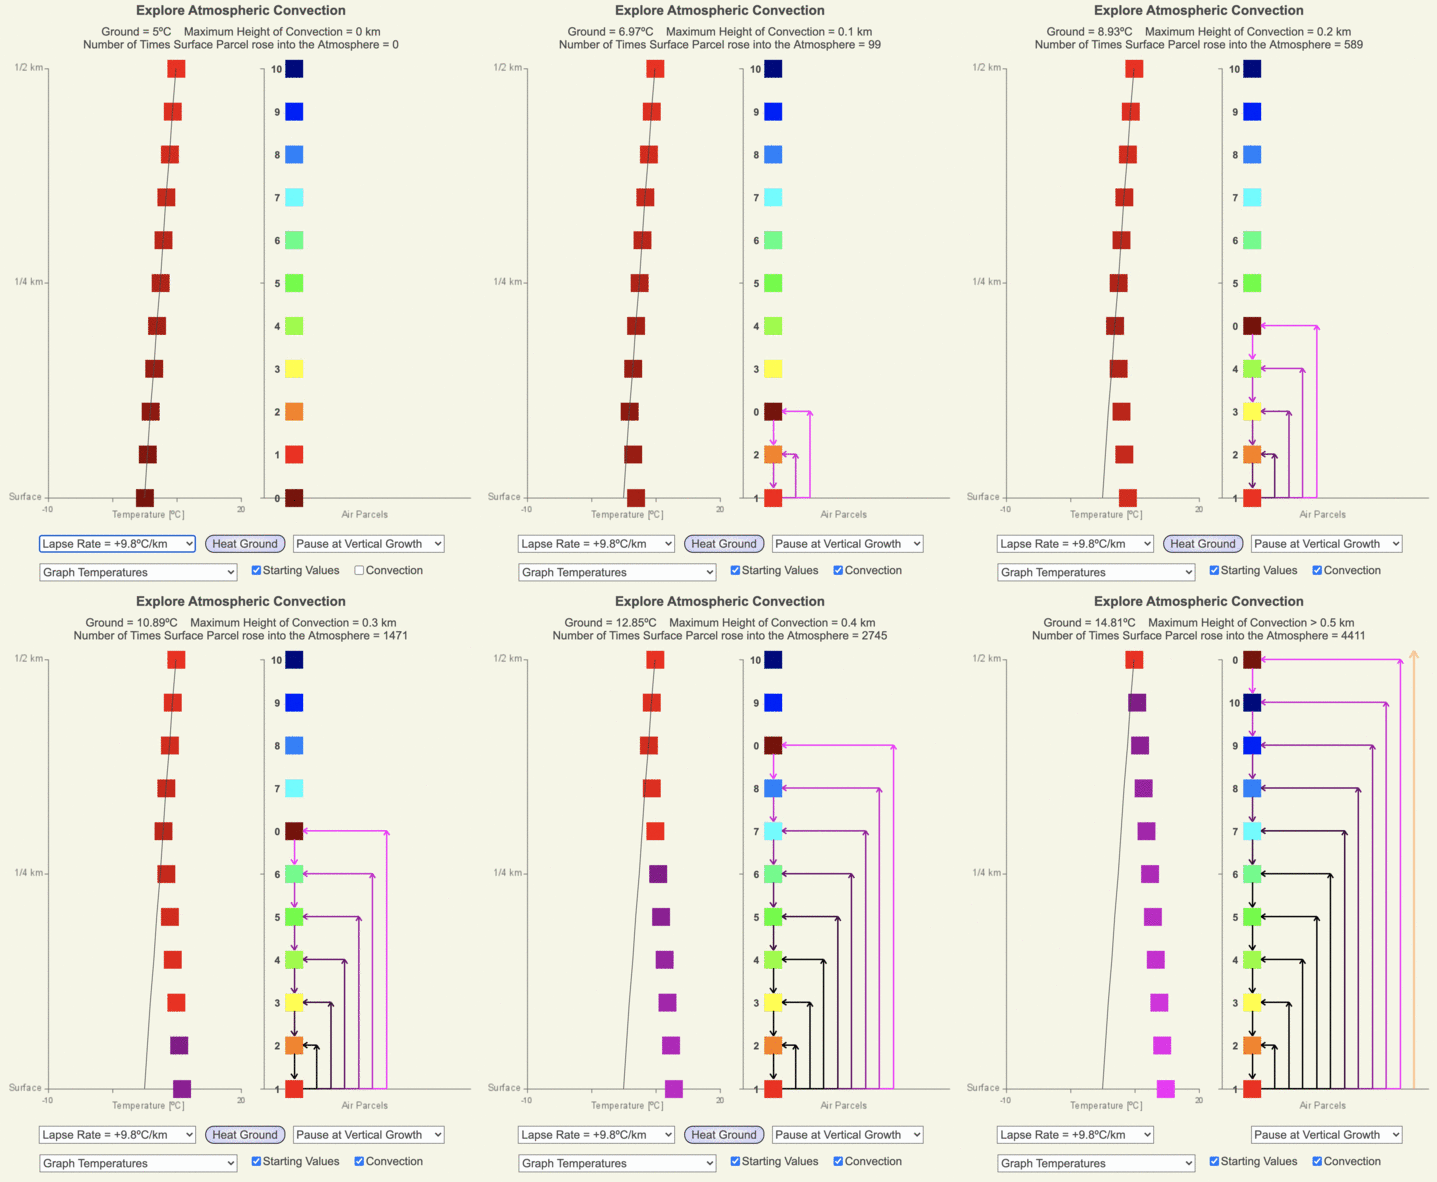
Animation of screenshots from the app, Convection, as atmospheric convection develops and changes as the ground warms.
Notice that only the air parcel at the surface warms. When it moves upward, and the air above comes down to the surface, warms, and it may rise as well. Ultimately these many convection cells of varying vertical height warm the column of air extending upward from the ground.
Useful Data and Visualizations
In the text at the top of the screen:
- The current ground temperature in ºC.
- The maximum height of the convection cells [km].
- The number of times the warmed surface parcels rose into the atmosphere.
In the left panel:
- The thin gray line shows the original temperature profile.
- The parcels’ current temperature is shown on the x-axis and with a color scale (blue being the coldest, red is warm, and magenta the hottest).
In the right panel:
- The frequency and range of sizes of convection cells are drawn in the magenta to black arrows. The darker the arrow, the more frequent that size convection cell occurred.
- The air parcels’ starting positions are shown by number and color (the original surface air parcel is labeled “0” and is dark red).
A Few Suggested Experiments using the Convection Web App
– Compare the number of convection cycles and the change in the ground temperature it takes to expand the convection cells vertically in 50 m increments for a given starting temperature profile.
– Compare the number of convection cycles and the change in the ground temperature it takes to expand a convection cell to a particular height for the various starting temperature profiles.
– How many convection cycles occur, and what is the tallest convection cell that occurs for a given amount of surface heating for the various starting temperatures?
Assumptions and Limitations of the Model
- The air parcels contain no water vapor.
- Ground temperature increases at 0.01ºC increments.
- The centers of the 11 air parcels are 50 m apart.
- The temperature profiles are simple, with constant change in temperature with height, which doesn’t capture the complexity of temperature profiles found in nature.
- The model only extends to 500 m (0.5 km), which is roughly 6% of the troposphere’s mass.
Diurnal Heating, Convection, and Temperature Inversions
Review how the Sun’s radiation warms the Earth’s surface during the day in Radiation Budgets and Diurnal Heating. As the Sun goes below the horizon, the warm ground radiatively cools, and the air near the ground cools through conduction with the surface. This creates a temperature inversion, with cool air beneath warm air. In the morning, when the Sun rises again, convection distributes heat from the ground into the lowest levels of the atmosphere to eliminate the temperature inversion.
As we can see in the two adjacent diagrams of the diurnal heating and cooling of two different surfaces, atmospheric convection and temperature inversions may be dramatically different within short distances of each other.
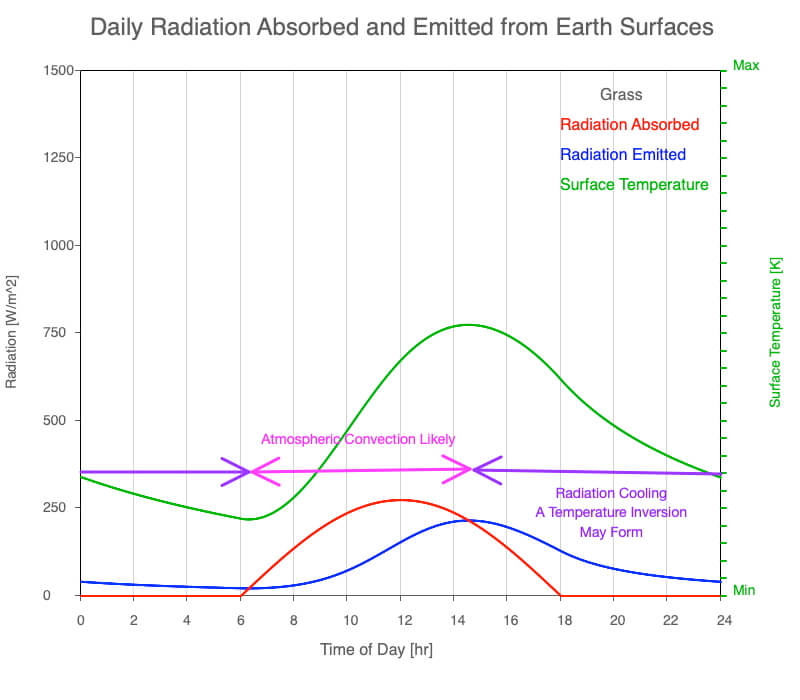
Diagram of diurnal heating over a grassy surface and when convection and temperature inversions may form.
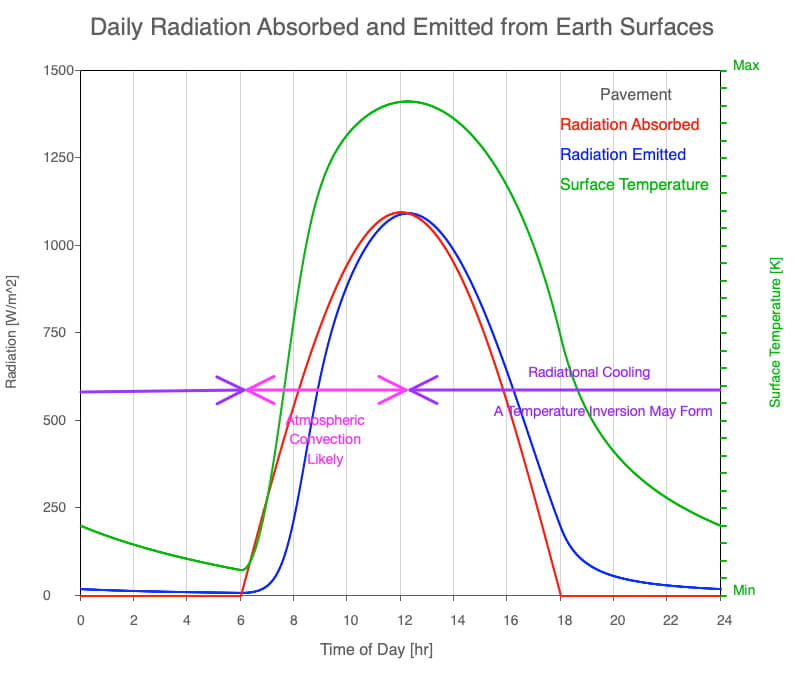
Diagram of diurnal heating over a paved surface and when convection and temperature inversions may form.
Real-Time and Archived Temperature Profiles
Twice daily, weather balloons that carry sensors into the atmosphere are released, and their data are used to analyze and forecast the weather around the globe. The University of Wyoming’s Department of Atmospheric Science provides free access to the real-time and archived temperature profiles. The setting on their website to create the easiest graphic to view the data is “GIF: to 10 mb.”
Use the data to find which areas experience the deepest convection (extend furthest from the ground) and the strongest temperature inversions during what days of the year and what time of the day. A guide to forecasting temperature inversions is available here. And if you are fascinated by temperature inversions, explore the 6 types found in the atmosphere. We have only explored one type of inversion on this webpage!
The Role of Water in Atmospheric Convection
The remaining sections in Clouds and those in Precipitation deal with the role of latent heat given off during condensation and taken in during evaporation as air parcels rise and sink in the atmosphere. Remember, water has an extremely high latent heat of vaporization. When water condenses within an air parcel as it rises, the heat of condensation offsets roughly half the cooling occurring due to expansion. The parcel will be less dense than if no condensation occurred, which may significantly increase the convection’s vertical extent.
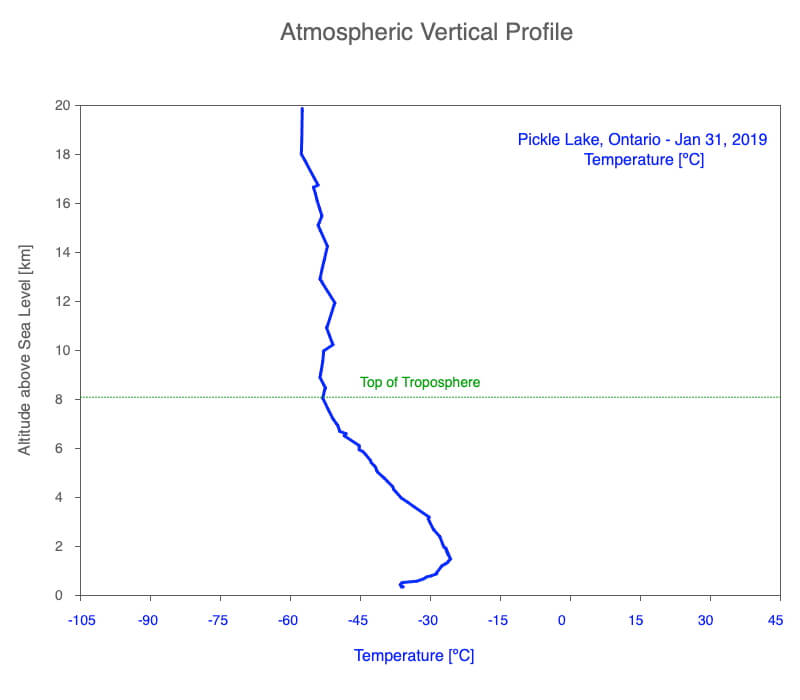
Temperature profile measured mid-winter at 7 AM Eastern Time at Pickle Lake, Ontario. Notice the temperature inversion extends to well over 1 km above the ground!

0 Comments