
Ideal Gas Law and the Troposphere
Atmospheric Instability
Atmospheric instability is the tendency of an air parcel to rise and create storms. Conversely, stability is the resistance of vertical movement within the atmosphere.
The environmental lapse rate (rate of temperature decrease with altitude) for the U. S. standard atmosphere is 6.5ºC/km within the troposphere. How does this compare to the temperature change for a rising parcel of air? The dry adiabatic lapse rate is 9.8ºC/km, so if buoyant air rose from the ground and remained unsaturated, it would quickly become neutrally buoyant and stop rising. If mechanically lifted, negatively buoyant surface air would return to the ground once past the object creating the lift. The lapse rate of the standard atmosphere resists the rising of surface air if the parcel remains unsaturated.
If the ascending air becomes saturated, it will cool at a rate of roughly 5ºC/km. The environmental lapse rate is higher than the moist adiabatic lapse rate. When water droplets form within a parcel, the latent heat of condensation warms the parcel. If it becomes warmer than the surrounding air, it will rise well into the troposphere. This lapse rate is known as conditional instability: if the conditions create a positively buoyant air parcel during saturation, it will ascend high into the troposphere. If saturation does not occur, surface air will not rise.
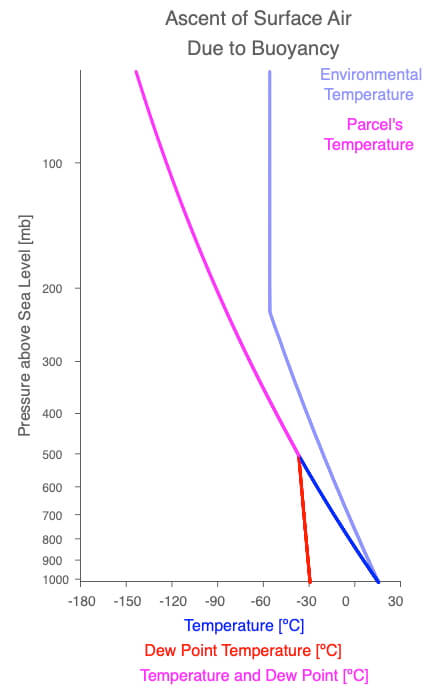
In the diagram above, the light blue environmental lapse rate is that for the U.S. Standard Atmosphere. The troposphere extends from the surface to roughly 220 mb. The dark blue line is the dry adiabatic lapse rate for an air parcel rising from the surface. If saturation does not occur, the parcel will remain colder than the surrounding air and sink.
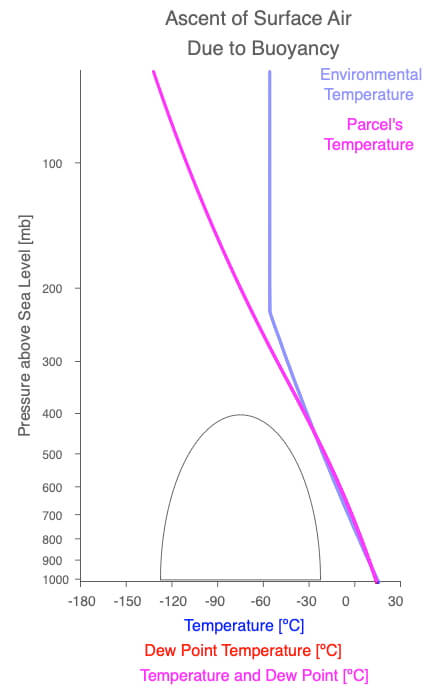
This is the same environmental lapse rate as the previous example. If saturation occurs within rising air near the ground, the parcel will continue to rise high into the troposphere. Because an unsaturated parcel won’t rise on its own (previous diagram) but would if saturation occurred, the atmosphere is conditionally unstable.
What if the lapse rate were less than the moist adiabatic lapse rate, say 0ºC/km? Then, even if saturation occurred, the parcel would be colder than the surrounding and would not rise. There are no conditions that would make parcel rise, so this lapse rate is stable.
Finally, what would happen if the environmental lapse rate were higher than the dry adiabatic lapse rate, say 10ºC/km? Surface air would rise immediately, and the atmosphere is unstable. Air from above would sink, and vertical mixing would change the lapse rate to be conditionally unstable.
For more on atmospheric instability for pilots, see the Aviation Weather website.
This concept map highlights the conditions that are needed for air to continue to rise higher into the troposphere. Notice that two conditions are needed to help get air to rise. The first, and most important, is that air will always rise if it is less dense than the surrounding air. For more information on the factors that affect air density, see Ideal Gas Law and Clouds. The second condition helps offset some of the adiabatic cooling of the rising air: the release of the latent heat of condensation. Since the rising air parcel is cooling less, the chances of it remaining less dense than the surrounding air improve.

Seasonal and Latitudinal Variation of the Troposphere
When air rises from the surface, it brings along its heat gained by conduction with the surface and water evaporated from the oceans, lakes, rivers, and soils; sublimated from glaciers; transpired by plants; and respired by animals. Not all rising air returns to the ground, so ultimately, heat and moisture mix with the air off the ground. Due to the latitudinal and seasonal heating patterns of the Earth’s surface, temperature and moisture profiles for the troposphere vary by latitude and season.
Key patterns from the atmospheric profiles:
- Water vapor decreases away from the ground, except at high latitudes during the winter.
- Environmental lapse rates vary with season and latitude and aren’t 6.5ºC/km.
- The top of the troposphere is lower at high latitudes and is lower during the winter months compared to the summer (excluding the tropics).
Above is an animation showing average temperature (blue) and dewpoint temperature (red) profiles for various latitudes and seasons.
Above is an animation showing average temperature (blue) and mixing ratio (red) profiles for various latitudes and seasons. Recall that the mixing ratio is the grams of water vapor relative to a kilogram of dry air.
Average vs Snapshot in Time
Since the Earth is unevenly heated, the atmosphere is in constant motion to eliminate temperature imbalances. Average temperature profiles eliminate daily changes. Compare the temperature and dewpoint temperature of the U.S. Standard Atmosphere to that for a winter day at Pickle Lake, the northernmost paved road in Ontario. The winds at different altitudes are transporting heat and moisture from different directions, creating intricate patterns of temperature and dewpoint temperature with height.
During the winter, the dark, cold conditions of Pickle Lake allow the ground to cool radiationally, which, through conduction, cools the air near the surface. This creates a strong temperature inversion where the temperature increases in height. The lapse rate for a temperature inversion is less than zero, and these are very stable atmospheric conditions.
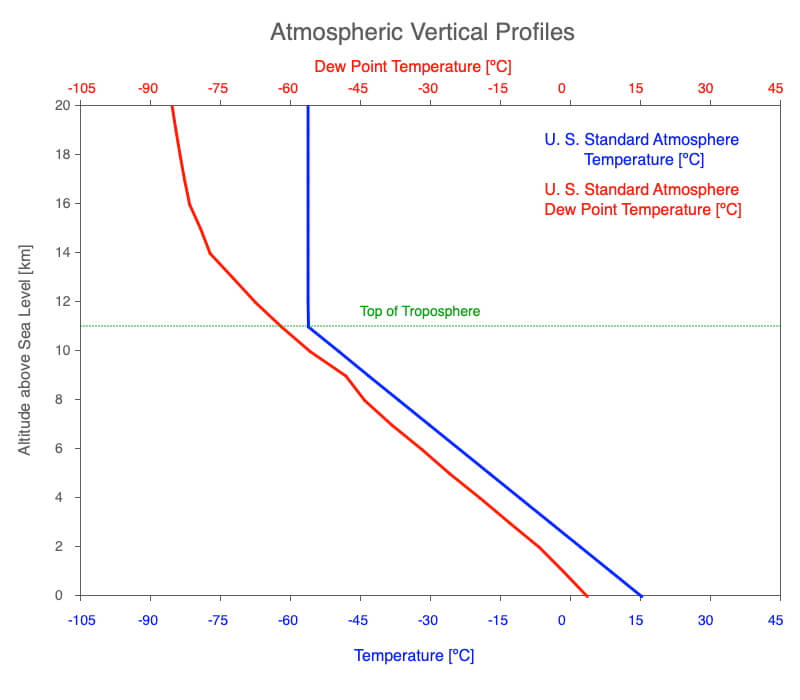
Above are the average temperature (blue) and dewpoint temperature (red) profiles for the U.S. Standard Atmosphere.
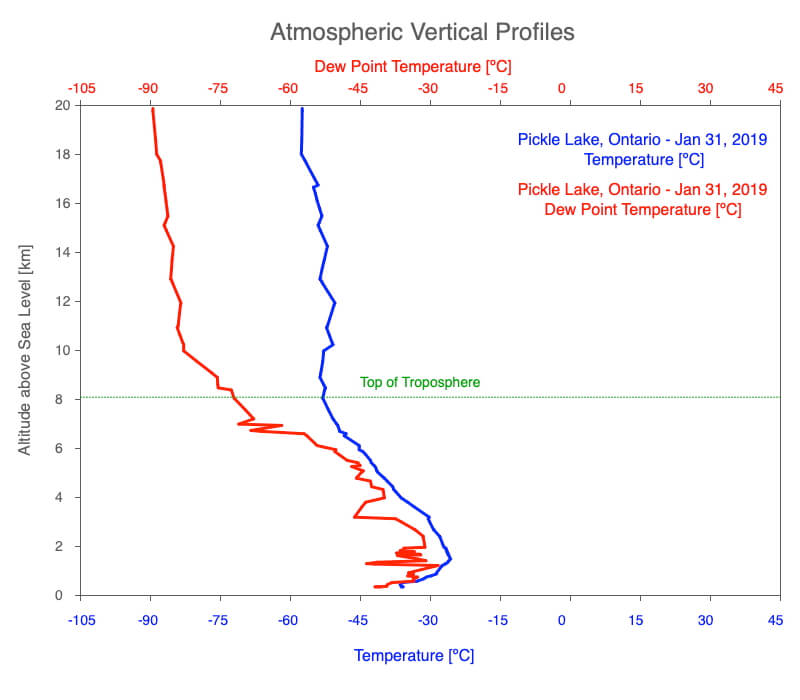
Above are the early morning temperature (blue) and dewpoint temperature (red) profiles for Pickle Lake, Ontario on January 31, 2019.
Visit the Vertical Atmosphere tab in the Atmosphere, Clouds, and Precipitation software to continue exploring variables of atmospheric profiles by season and latitude. Go to the Software page to download a version for Macs or PCs.
0 Comments