Interpreting Time on Declination Circles
We can use declination circles to accurately estimate the time of day using the Sun’s location in the sky. To obtain precise times, however, we would need to consider the refraction of sunlight as it travels through the Earth’s atmosphere, the effect of Earth’s slightly eccentric (elliptical) orbit, and the longitude (to take into account the time zone and is needed to convert sun time to clock time).
Recall that the Sun moves 15º along its declination circle each hour. There are other ways to view its motion: one is based relative to the circle’s top and bottom, which is what you would observe when viewing the declination circle from the side (this would be the y-axis for those familiar with a circle centered on the origin of a graph) (adjacent animation).
When viewing a declination circle from the side, regardless of the declination circle’s orientation (unless it represents the Sun’s motion at the North or South Pole),
-
- local noon is at the highest point of the declination circle,
- local midnight is the lowest, and
- 6 AM/PM are the midpoint.
These are true for any declination circle except for those at the poles where solar time does not exist since the Sun moves parallel to the Pole’s horizon. Notice that the rate of change in the Sun’s angle above the horizon is greatest at sunrise and sunset and least during local noon.
Click a button above to run one of the web apps to explore time on a declination circle. Supporting information follows as well as additional buttons to run the apps.
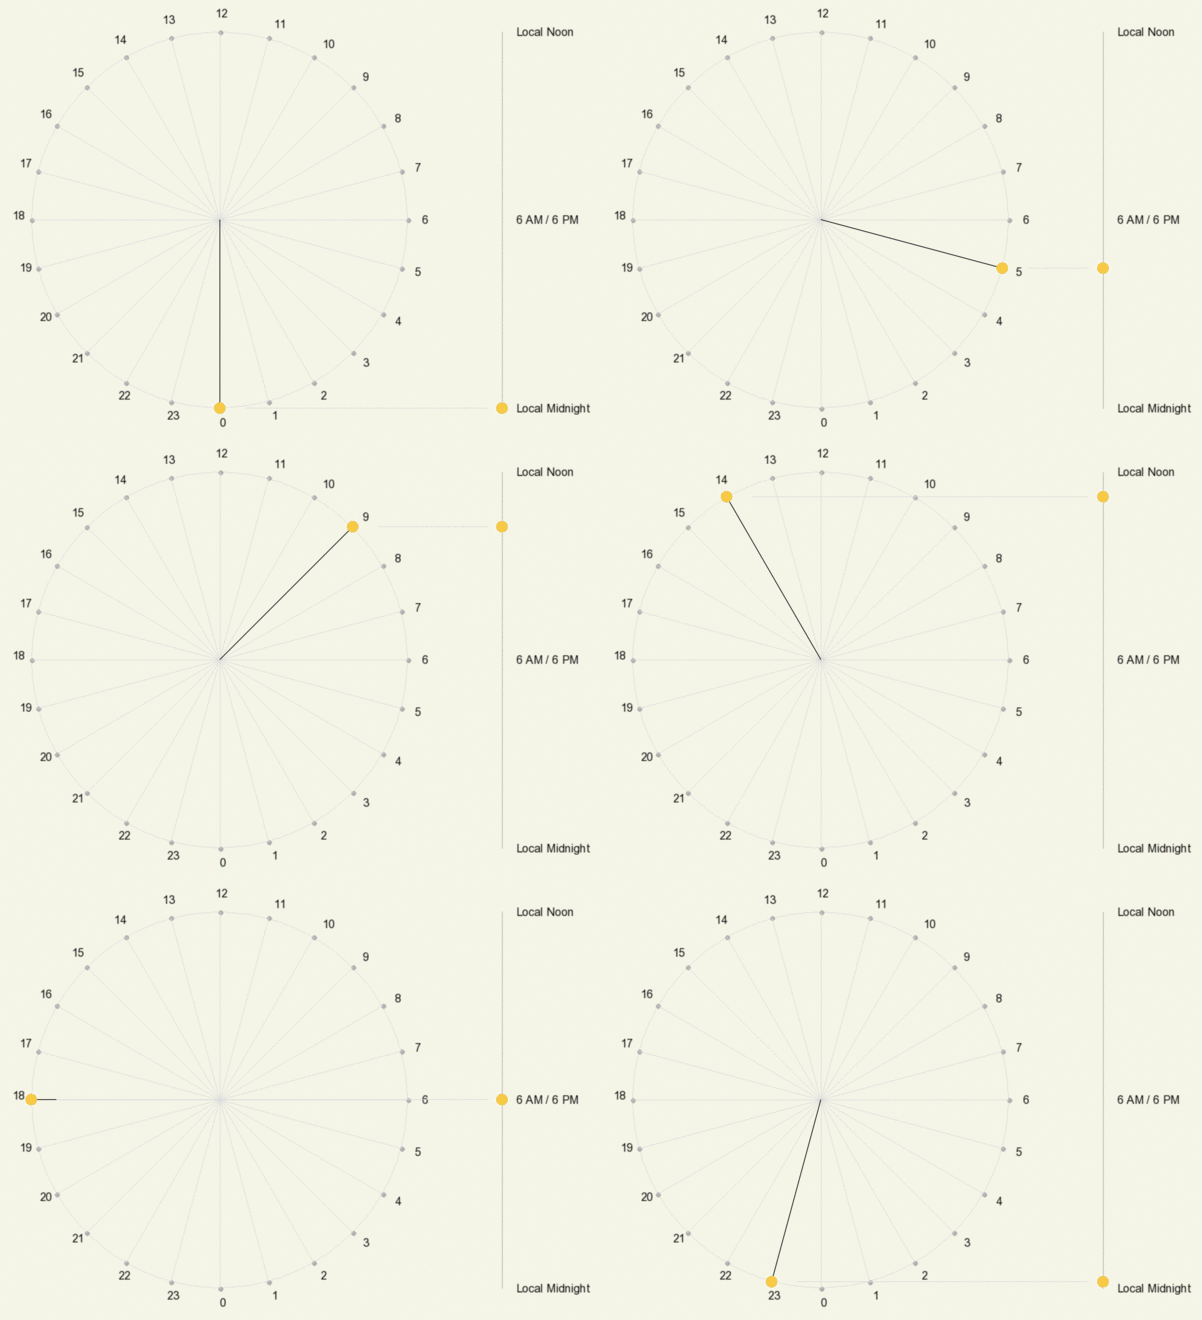
Animation showing the hourly position of the Sun on a declination circle when viewed from the front (left) and the side (right). Time on the left is shown as 24-hour time, where, for example, 18 = 6 PM.
Calculating Time on a Declination Circle
Right angles are handy when making calculations of position on a circle. In this case, create a right triangle with one of the angles defined by the hours from 6 AM/PM. In the adjacent diagram, the position of 8 AM is calculated, so the angle from 6 AM is 2 hours * 15º/hour = 30º.
Recall from Right Triangles and Vectors that the side of the triangle opposite the 30º angle = radius of the circle * sin(30º). The 30-60-90 triangle is one of the “special” triangles learned in geometry and trigonometry. For a unit circle (radius = 1), the side opposite 30º = 0.5. For a circle with an unspecified radius, the length of the side opposite 30º = 0.5 * radius.
This means that the position of the Sun at 8 AM is halfway between the midpoint and the highest point of the declination circle (local noon), 1/4 of the total length from the top of the declination circle, or 3/4 of the total length from the bottom (local midnight):
3/2 * radius / (2 * radius) = 3/4
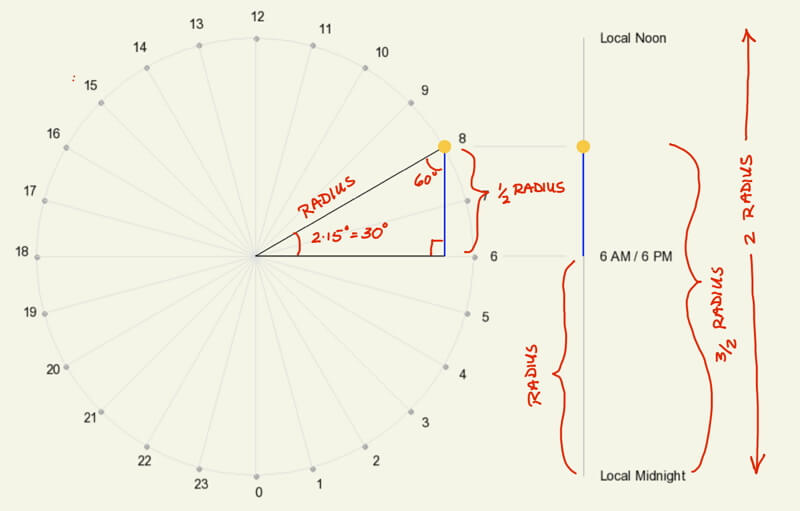
To calculate the Sun’s position on a declination circle, use the central angle defined by the angle away from either the 6 AM or 6 PM. In this example, the angle is 30º or 2 hours * 15º/hour. The distance away from the midpoint (the blue line) equals the radius of the circle times sin(30º).
Time on a Declination Circle App
Explore the hourly position of the Sun on declination circles using the web app that follows. When we view a straight line, we often assume that change is constant, but that is not the case for the Sun’s position on a declination circle when viewed from the side. When creating a declination circle by hand, we draw this view first since it is easiest to draw.
Click the button above to run the web app for tablets, laptops, and desktops.
Acknowledgments
I want to thank Mason Glidden and Matti Horne for their insightful suggestions during beta testing.
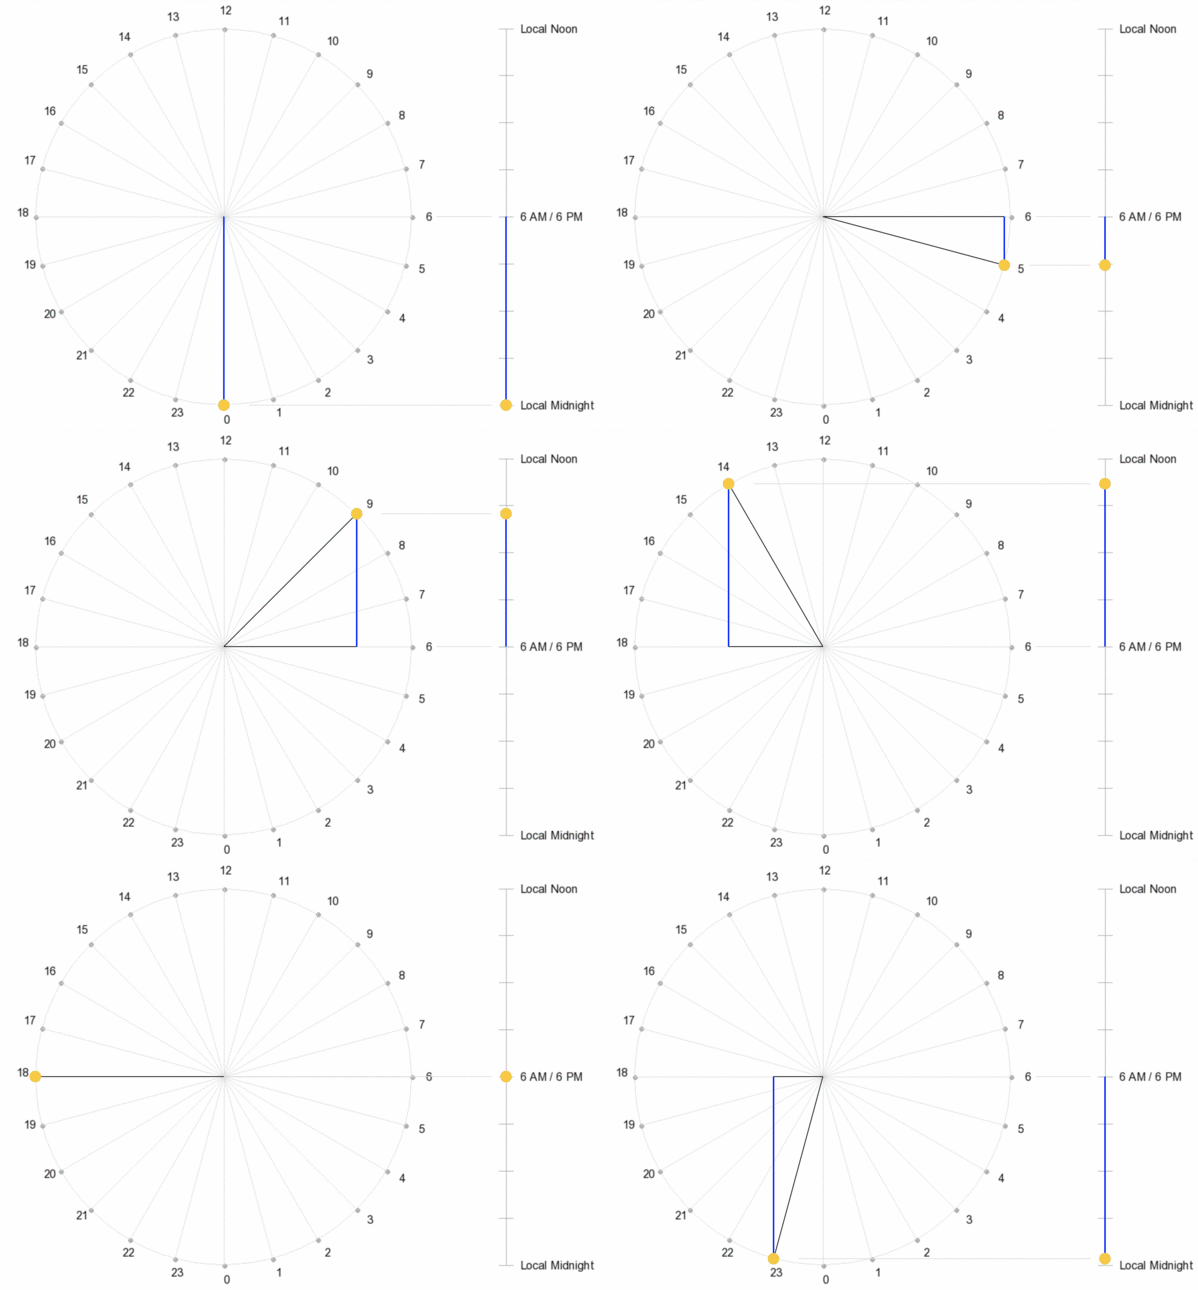
Animation showing the right triangles used to calculate the hourly position of the Sun on a declination circle when viewed from the front (left) and the side (right). Use the toggle below to view the distances from the midpoint of the declination circle.
Table of Lengths from the Declination Circle's Midpoint
| Time of Day | Distance from Midpoint to Top (+) or Bottom (-) of Declination Circle |
| 12 PM ( noon) | 1 Radius |
| 11 AM & 1 PM | 0.97 Radius |
| 10 AM & 2 PM | 0.87 Radius |
| 9 AM & 3 PM | 0.71 Radius |
| 8 AM & 4 PM | 0.5 Radius |
| 7 AM & 5 PM | 0.26 Radius |
| 6 AM & 6 PM | 0 (midpoint) |
| 5 AM & 7 PM | -0.26 Radius |
| 4 AM & 8 PM | -0.5 Radius |
| 3 AM & 9 PM | -0.71 Radius |
| 2 AM & 10 PM | -0.87 Radius |
| 1 AM & 11 PM | -0.97 Radius |
| 12 AM (midnight) | -1 Radius |
Estimating Time using “Eighths”
The previous table consists mostly of values that are not easily memorized, but there is a pattern if you relax your expectations. I find it interesting that many values are close to a multiple of 1/8, which is 0.125 in decimal form.
Dividing a Line into Eighths
It would be difficult to estimate 1/8 of the total length of a line and replicate this across the line’s length, but we are very good at estimating the point halfway between two points.
STEP 1: Start with the points for local noon and local midnight. Mark the point halfway between, which represents 6 AM/PM.
STEP 2: Mark the positions halfway between 6 AM and local noon and between 6 pm and local midnight. The first of these points is a good approximation for the position of the Sun at 8 AM and 4 PM, and the second is a good approximation for 4 AM and 8 PM. The declination circle is now divided into quarters.
STEP 3: Find the points halfway between the four points created in Step 2. The line is now divided into eighths, and you can complete estimating the times of the Sun for these positions using the diagrams and the Table of Eighths Scale on this page or the with the web app, Time Declination Circle.
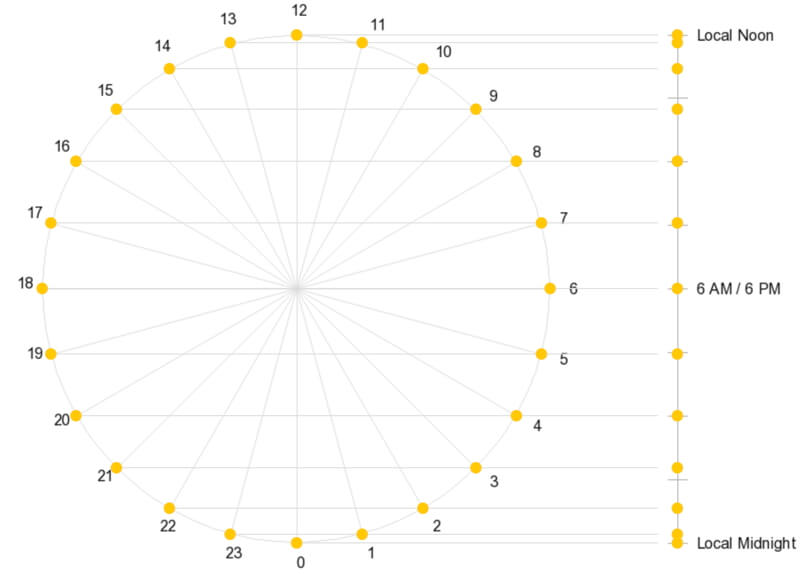
Many of the hourly positions of the Sun are near multiples of 1/8th of the diameter of the declination circle (shown in the gray tick marks on the image on the left). This pattern makes it easier to estimate the time when using declination circles to study the Sun’s motion during the day. To view the values, click on the toggle below.
Table of Eighths Scale
| Time of Day | Relative Distance from Midpoint to Noon or Midnight Position | Relative Distance from Midnight Position |
| 12 PM ( noon) | 1 | 1 |
| 11 AM & 1 PM | ~31/32 | ~63/64 |
| 10 AM & 2 PM | ~7/8 | ~15/16 |
| 9 AM & 3 PM | ~3/4 | ~7/8 |
| 8 AM & 4 PM | 1/2 | 6/8 |
| 7 AM & 5 PM | ~1/4 | ~5/8 |
| 6 AM & 6 PM | 0 (midpoint) | 4/8 |
| 5 AM & 7 PM | ~1/4 | ~3/8 |
| 4 AM & 8 PM | 1/2 | 2/8 |
| 3 AM & 9 PM | ~3/4 | ~1/8 |
| 2 AM & 10 PM | ~7/8 | ~1/16 |
| 1 AM & 11 PM | ~31/32 | ~1/64 |
| 12 AM (midnight) | 0 | 0 |
Practice Estimating Time on a Declination Circle
A declination circle’s length and orientation depend on the location’s latitude and the day of the year, so practice estimating time on declination circles between 89ºN and 89ºS for any day of the year using the Sun Time Challenges app below. An illustrated example follows to help you develop your estimation skills.
If you have a known position on a declination circle, you don’t need to divide its entire length into eighths. Keep dividing the length that contains the position in half until you can decide which eighth is it closest to. For an example, see the adjacent animation.
Click the button above to run the web app for tablets, laptops, and desktops.
Acknowledgments
Thanks to Mason Glidden and Matti Horne for their suggestions during beta testing. Special thanks to Matti for redesigning our certificate of completion!
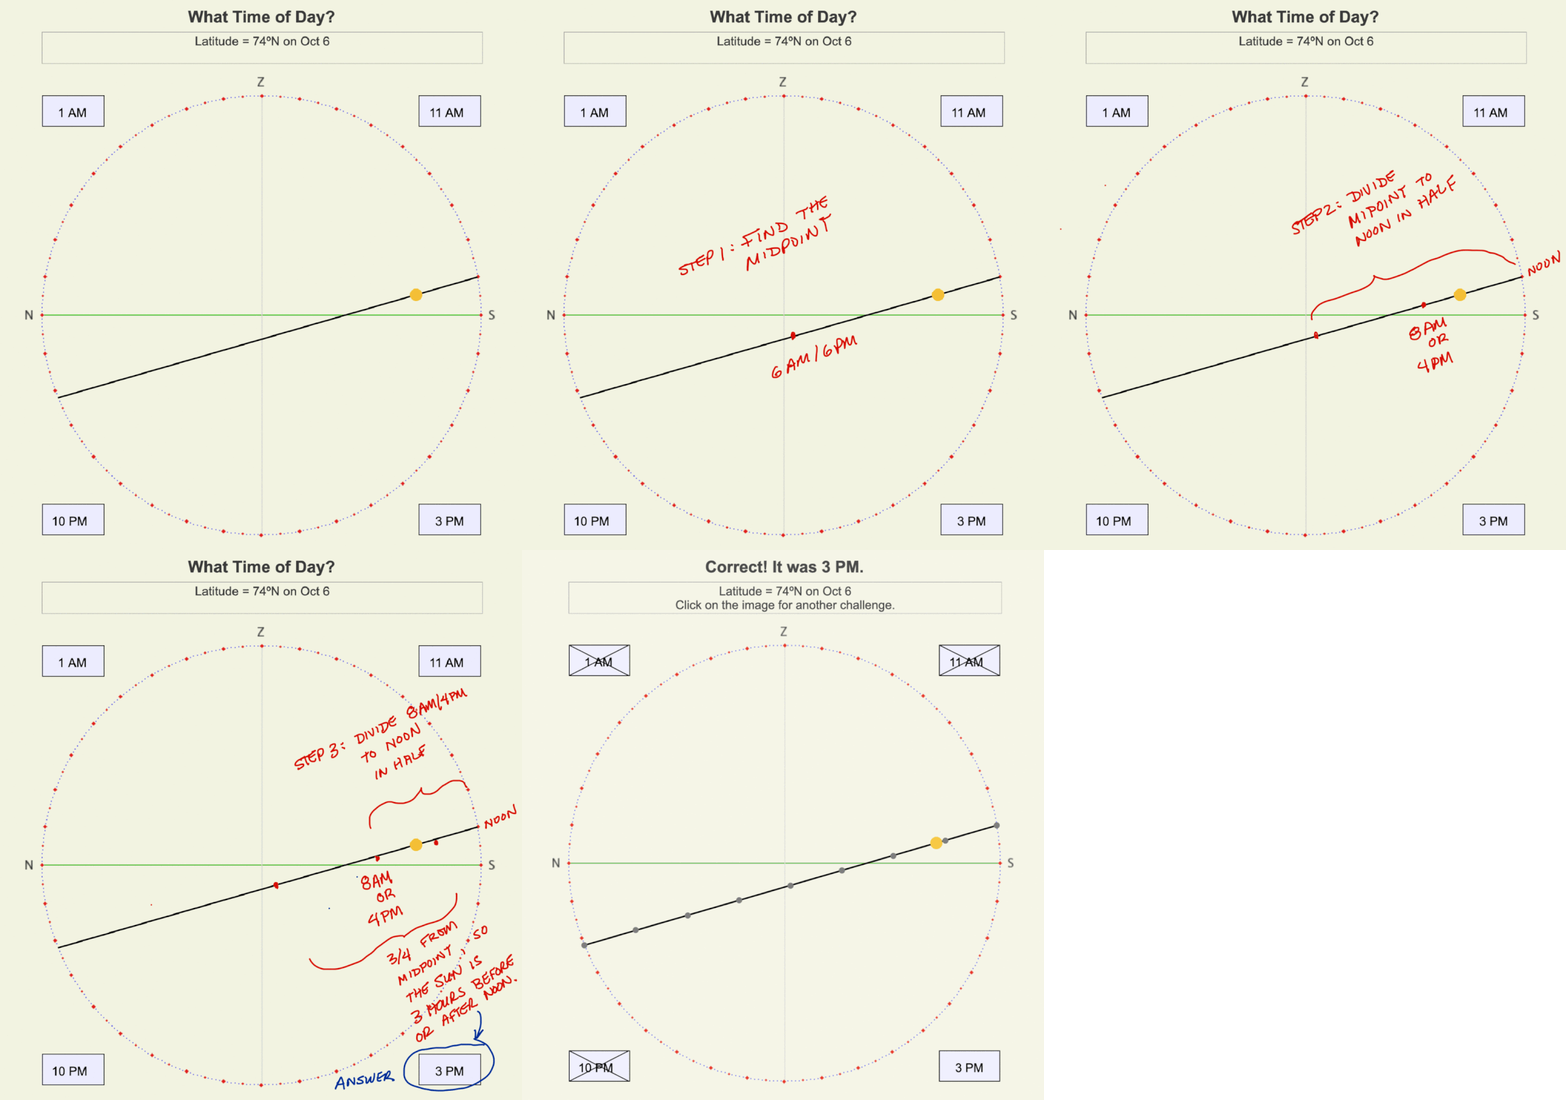
Animation showing the steps to estimate time on a declination circle for 74ºN on October 6. Notice that you don’t need to divide the entire length of the declination circle into eighths. Rather, work your way toward the Sun’s position by halving the part of the line that contains the Sun.
Graphs as Calculating Tools
Graphs are valuable tools for visualizing spatial patterns and relationships between variables, and they may be useful as computers for making calculations. For example, meteorologists calculate the thermodynamic response of rising and sinking air using Skew-T diagrams, which map the relationships between air pressure, altitude, temperature, dew point temperature, and mixing ratio. Using graphs with more than one plotted variable requires that we first focus on separate elements for a given position on the graph and then combine those data to create an integrated understanding of the variables’ connections. Our declination circle graphs provide the same opportunity when displaying the grids for the Sun’s angle relative to the horizon and the Sun’s direction in the sky. Use the Sun Time Challenge web app to practice calculating the solar time based on the Sun’s position on the declination circle with and without the grids. When the grids are displayed, can you calculate the position of the Sun in the sky? It’s amazing to think that you can make these complicated measurements without a computer!
Sun Angle and Direction Grids
You could draw both of these grids by hand following the Eighths Scale illustrated above. For each set of gridlines, the 30° line is halfway between the circle’s center and the respective maximum and minimum values of each variable.
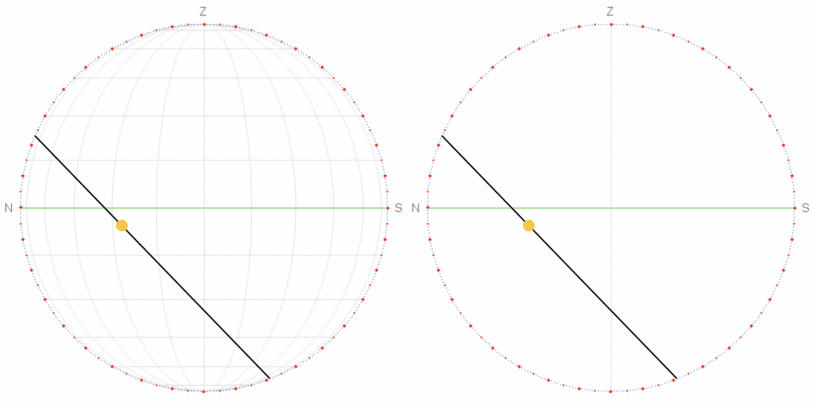
Animation showing a declination circle with and without sun angle and direction grids. Which is easier to help you tell time on a declination circle?
Use the Sun Time Challenges web app to practice identifying the solar time with and without the grid.
Mathematically Calculating Time on a Declination Circle
You may calculate any time on the declination circle by reversing the process described above. For example, use the declination circle for 20ºN on February 1 (illustrated in the adjacent figure) to find the time of sunrise, sunset, duration of daytime, and length of nighttime.
Step 1: Measure the length of the declination circle above and below the horizon. In this example, 6 cm was above and 7.8 cm below.
Step 2: Add together to calculate the length of the declination circle (13.8 cm).
Step 3: Find the midpoint, which is the position of 6 AM/PM: 6.9 = 13.8 / 2
Step 4: Calculate the distance from the sunrise to 6 AM: 6.9 – 6 = 0.9 above midpoint.
Step 5: Calculate the percent distance from the midpoint: 0.9 / 6.0 x 100 = 13%
Step 6: Interpolate the time from the Eighths Table above: 13% is roughly half of 25%, so sunrise is 6:30 AM and sunset is 6:30 PM.
Note: You may also use inverse trig functions:
sin θ = 0.13
θ = sin¯¹(0.13) = 7.47º
Time from 6 AM/6 PM = 7.47º/(15º/hour) = 0.5 hours
So for small angles, interpolation works quite well!
Step 7: Subtract sunrise from sunset to calculate the length of daytime: 11 hours = 6:30 PM – 6:30 AM
Step 8: Length of nighttime = 24 – hours sunlight = 24 – 11 = 13 hours.
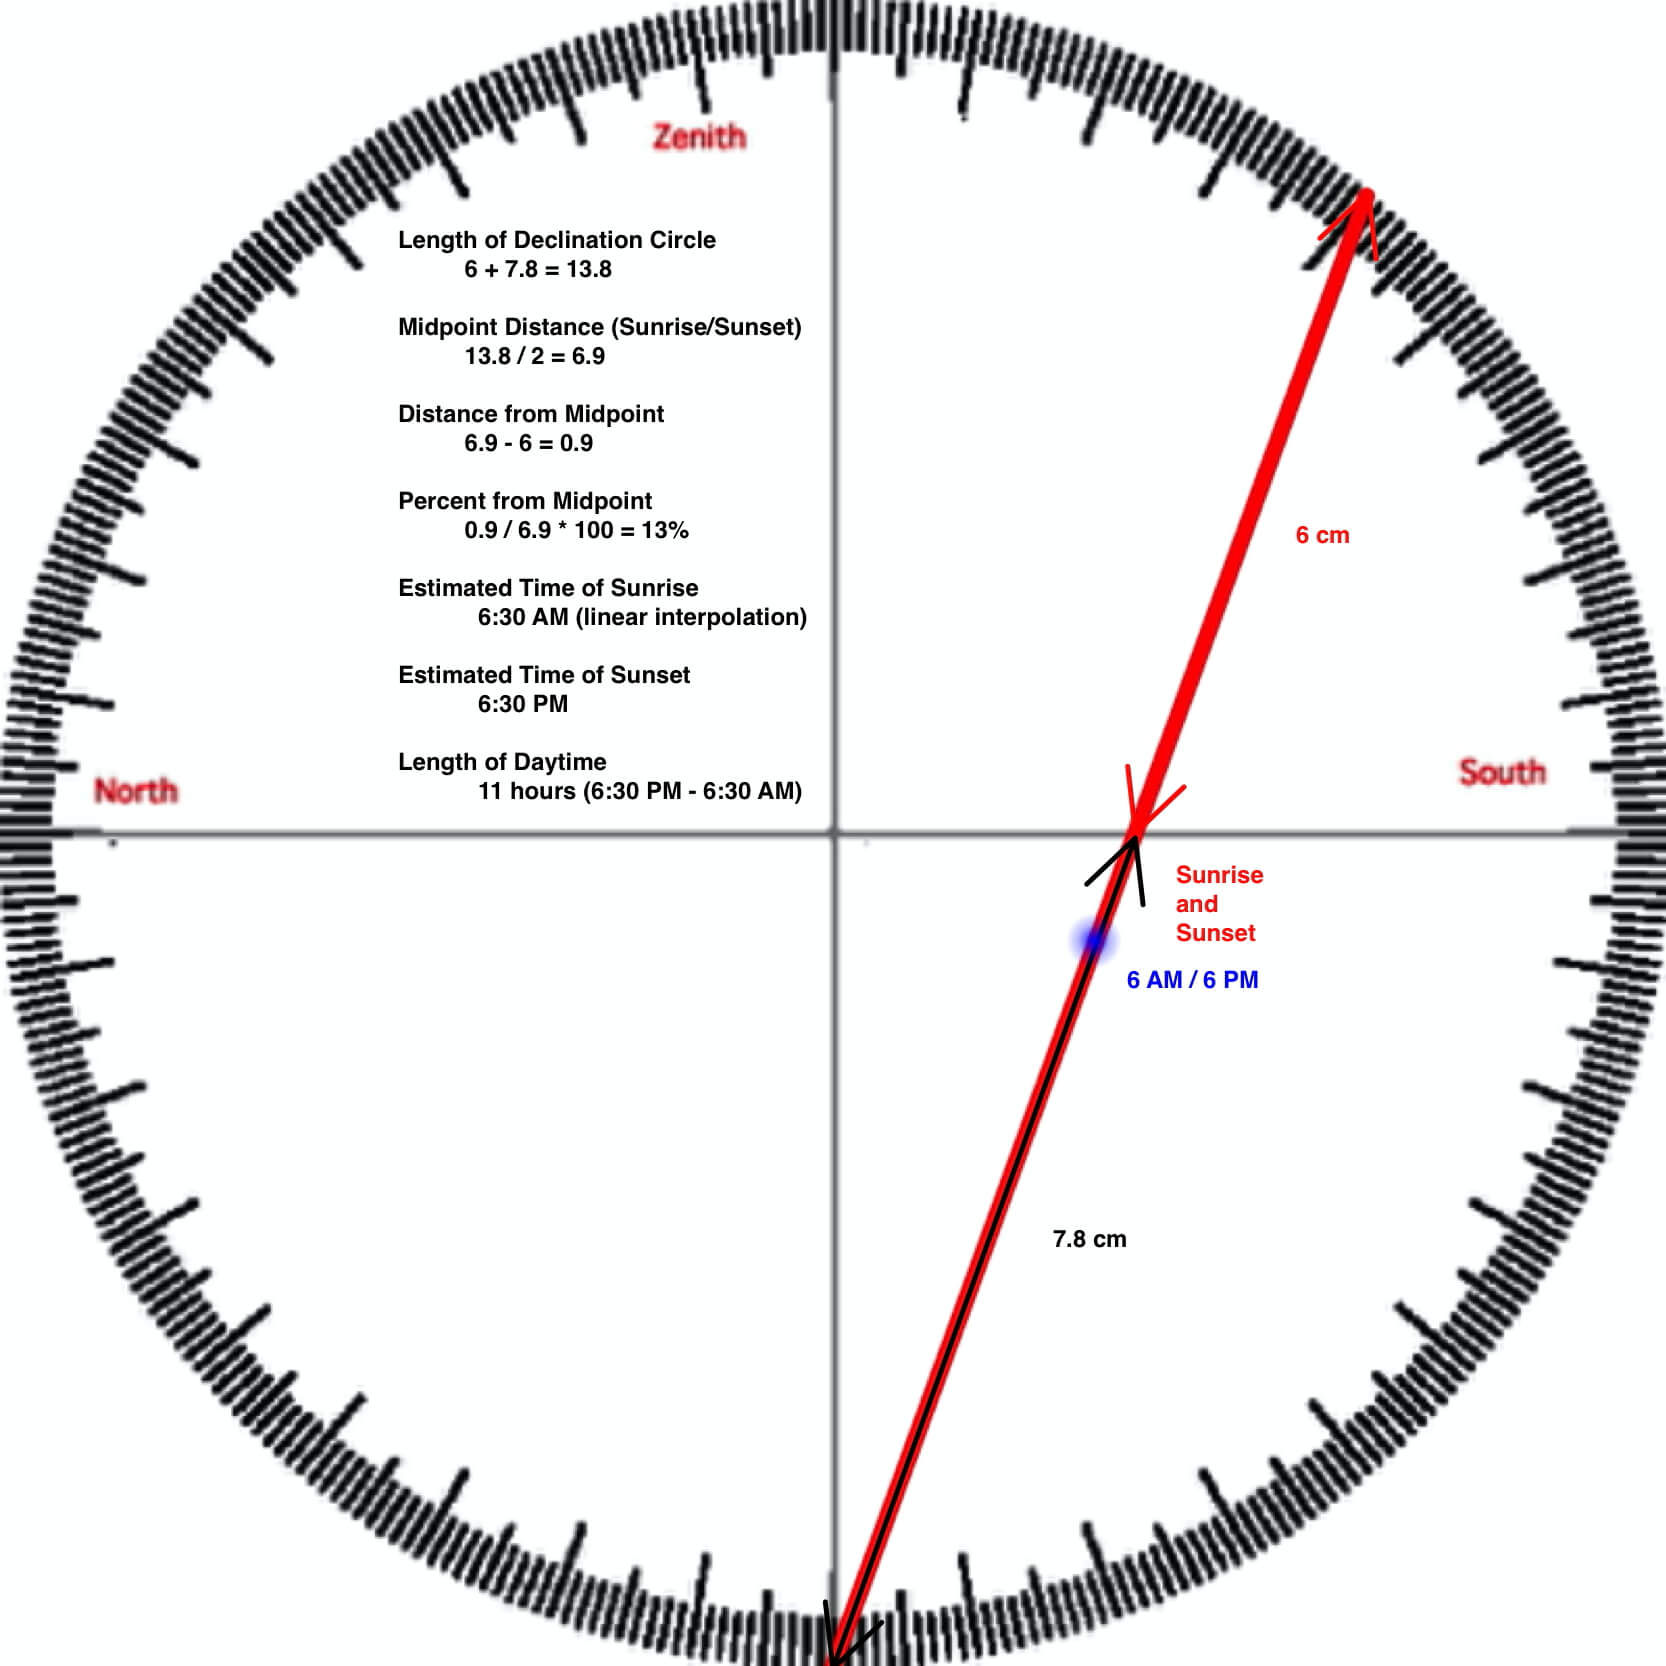
Above is a declination circle for 20ºN on February 1. Sunrise and sunset may be found where the declination circle crosses the horizon.
Big Ideas
- Declination circles map the path of the Sun across the sky as viewed from a point on the Earth’s surface at a given latitude and day of the year.
- To draw a declination circle by hand, you need to know your latitude and the solar declination for the day you are interested in.
Click on the following toggles to view descriptions and links of the web pages on each topic of the Sun-Earth Connection.
Sun-Earth Connection overview
An overview of how the Sun’s energy is generated and how its thermal radiation illuminates and heats Earth.
Earth Illumination Patterns
- Overview: The Sun illuminates the spherical, rotating planets orbiting it.
- Obliquity and Earth’s Illumination: Obliquity is the angle between the planes of the Earth’s equator and its orbit around the Sun.
- Declination, Latitude, & Earth Illumination: Solar declination is the angle between the Sun’s rays and the plane of the Earth’s Equator. Its value depends on where Earth is in its orbit around the Sun.
- Astronomical Seasons & Illumination: Astronomical seasons are based on the orientation of Earth’s axis of rotation to the Sun, which determines the amount of illumination between the Northern and Southern Hemispheres.
Distribution of the Sun's Energy on Earth
- Overview: Even though an area is illuminated by sunlight, there can be quite a range of energy interacting with the surface.
- Sun Angle and Beam Concentration: If every beam of sunlight reaching Earth has the same amount of energy, why do some areas warm up more than others?
- Diurnal Heating: Diurnal heating is the temperature change over 24 hours. When sunlight shines on the ground, it warms. Two critical factors that determine the amount of heating deal with the Sun’s illumination.
- Seasons: Earth experiences astronomical seasons due to its obliquity.
- Climate Regimes: Climate regimes are an extension of diurnal heating and seasons, but the time frame is now years.
Declination Circles: A tool to analyze the Sun's position in the sky.
- Overview: Drawings of declination circles contain the visual and numerical information to understand and predict the Sun’s motion across the sky.
- Declination Circles 101: Draw a declination circle with just a ruler and protractor/compass to quickly and accurately know the Sun’s position in the sky at any day and time of the year for any location on Earth.
- Drawing Declination Circles: Declination circles are quite easy to draw by hand.
- Interpreting Time on Declination Circles: Accurately estimate the time of day using the Sun’s location in the sky.
- Sunrise, Sunset, & Twilight: Calculate the timing and duration when the Sun is at or near the horizon.
- Solar Time, Angle, & Position: The sun’s angle and direction to the local horizon define the Sun’s position in the local sky. Explore how to use declination circles to calculate the Sun’s position at any solar time anywhere in the world on any day of the year.
- Changing Views of Declination Circles: Use the web app View Declination Circles to explore three common views of declination circles to identify their strengths, limitations, and applications. Then learn how to go from one view to another.
- Using Declination Circles: Humans have been using the apparent motion of the Sun as a compass, clock, and calendar for millennia.
- Using Sundials: Humans have been using the Sun’s position to navigate and tell the time, day, and season for millennia. Sundials create shadows that make it easier to do these tasks.

0 Comments