Measurement
Measurements are observations that place a value on the property of an object, and humans have had a passion for making measurements for a very long time. It may be a numerical value, but it doesn’t have to be. For example, a person may be a senior citizen, which is a measurement that doesn’t indicate their actual age. To be useful to a large number of people, measurements are based on one or more standards. For example, the second, an important unit of time, was originally based on the amount of time to orbit our Sun, but is now is based on a more precise standard, the period of radiation emitted from cesium. Interestingly, the definition of a senior citizen is not consistent, which creates quite a bit of confusion for those in their late fifties to early sixties.
If the measurement is numerical, there are three types: ordinal, interval, and ratio. Each type of numerical data dictates the set of mathematical analyses that may be applied, such as whether the values may be added, subtracted, multiplied, or divided. Mathematically manipulating measurements provide additional tools to extend our ability to observe.
There are additional analysis tools that extend our observations. Graphing data quickly show time, spatial, and frequency trends, mapping data (contouring) illustrates how data are spatially organized, and statistics help identify a correlation between variables. Data measurements are also used in computer models that provide forecasts such as our weather forecasts.
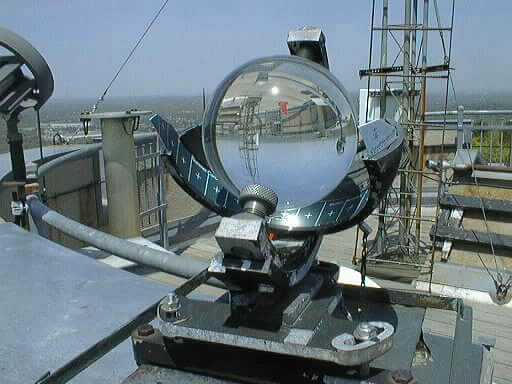
The pyrheliometer at the Blue Hill Observatory focuses sunlight onto waterproof paper in which the width of the burn measures how much sunlight was reaching the crystal ball. As the Sun changes position in the sky, the burn moves across the paper.
Accuracy and Precision
The quality of data is determined by its accuracy and precision. Accuracy is a measurement’s closeness to ‘truth’ (a known value or a standard). A highly accurate measurement is close to the truth, a low accuracy is quite far from the truth. Rather than rely on one measurement to determine the accuracy of an instrument and the procedure to use it, many measurements are averaged to check its accuracy.
Precision is the repeatability of a measurement. If a number of measurements are close to each other, so highly repeatable, they are highly precise, and if they differ quite a bit, the measurements have low precision.
Below are four examples of measurements of a two-dimensional variable, such as the latitude and longitude of one’s position on Earth or wind velocity.
Accuracy and Precision Web App
To continue visualizing accuracy and precision beyond the graphs below, use the web app below. Change the degree of accuracy and precision and a randomized data field is displayed illustrating the results.
Graphs, similar to those below, may be saved to your computer.
Click the button to run the app for a laptop or tablet.
Click the button to run the app for a laptop or tablet.
Acknowledgments
I want to thank Max Hall and Will Tucker for their “precise” suggestions during beta testing.
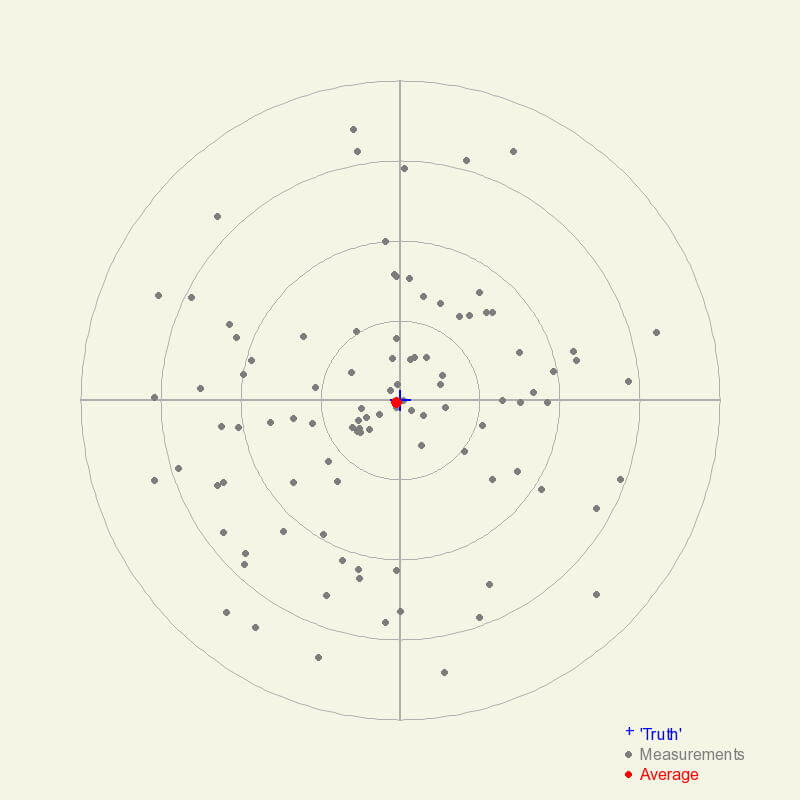
Measurements (gray dots) with high accuracy but low precision. The average of the measurements (red dot) is very close to the ‘truth’, indicating high accuracy if there are many low-precision measurements taken.
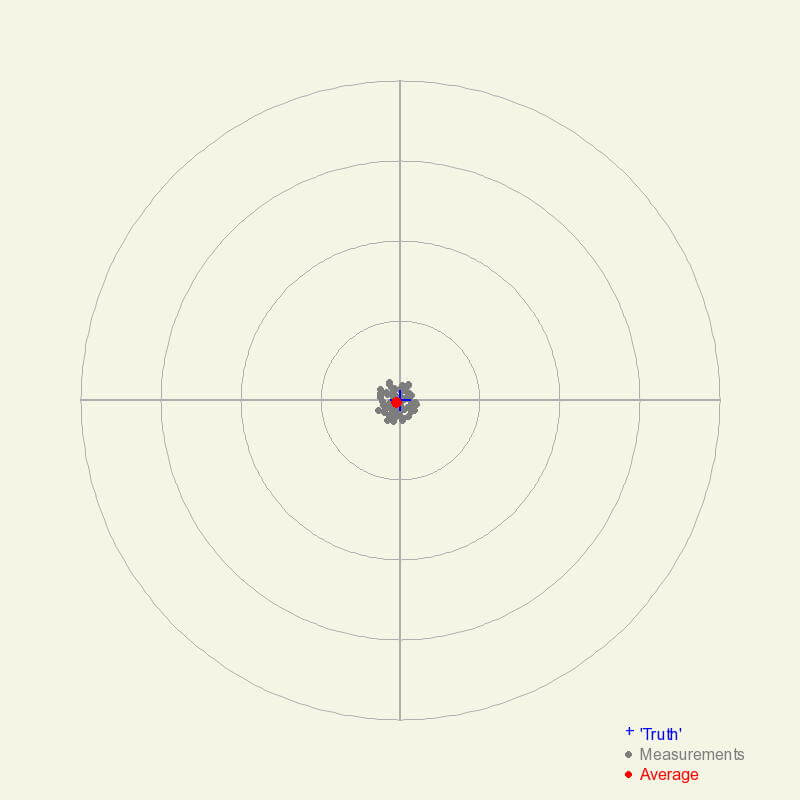
Measurements that are highly accurate with high precision. The average measurement is very close to the true value, and all of the measurements are close to the average value. The chances a given measurement is close to the truth are quite high in this scenario.
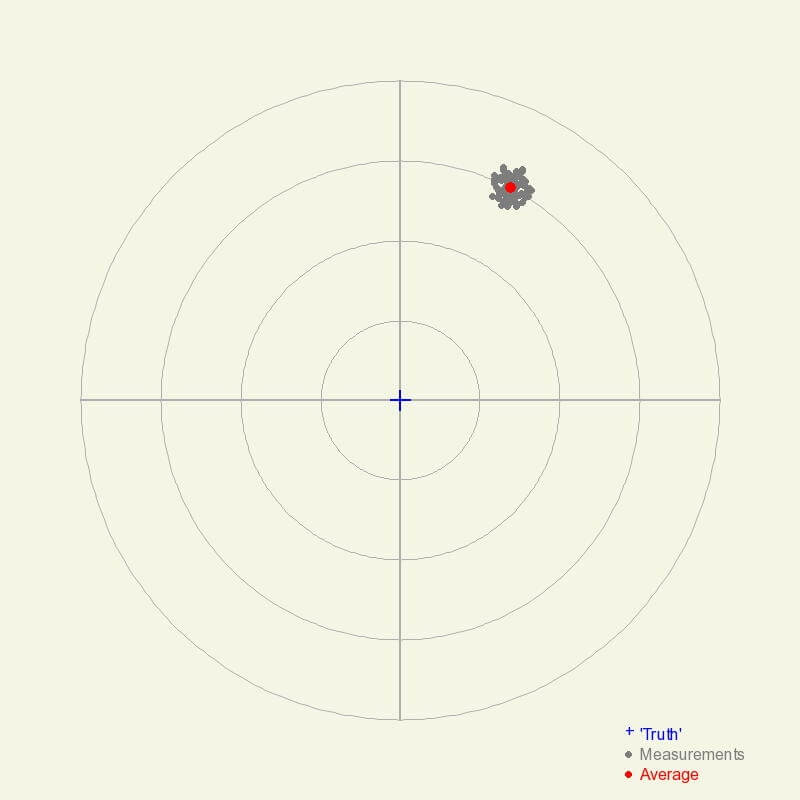
Although the measurements are highly precise, they are not accurate. This could be a result of a variety of reasons such as improper calibration, the instrument is broken, or the conditions exceed those for which the instrument was designed.
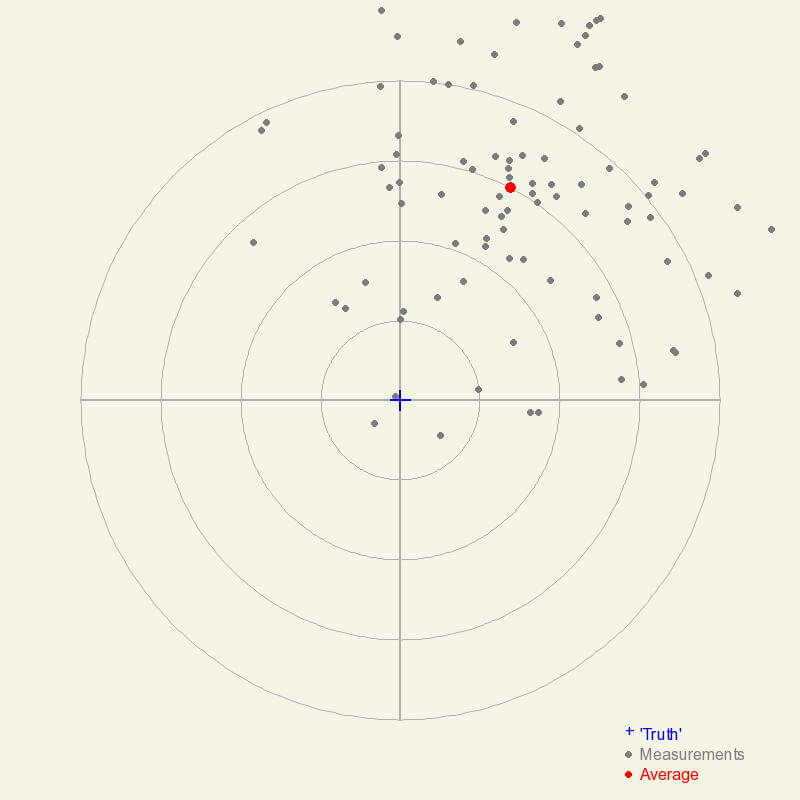
When measurements differ from each other for the same object (low precision), it is often challenging to recognize if the measurements are also not accurate. Notice that the average measurement differs quite a bit from the ‘true’ value.
One- and Two-Dimensional Data
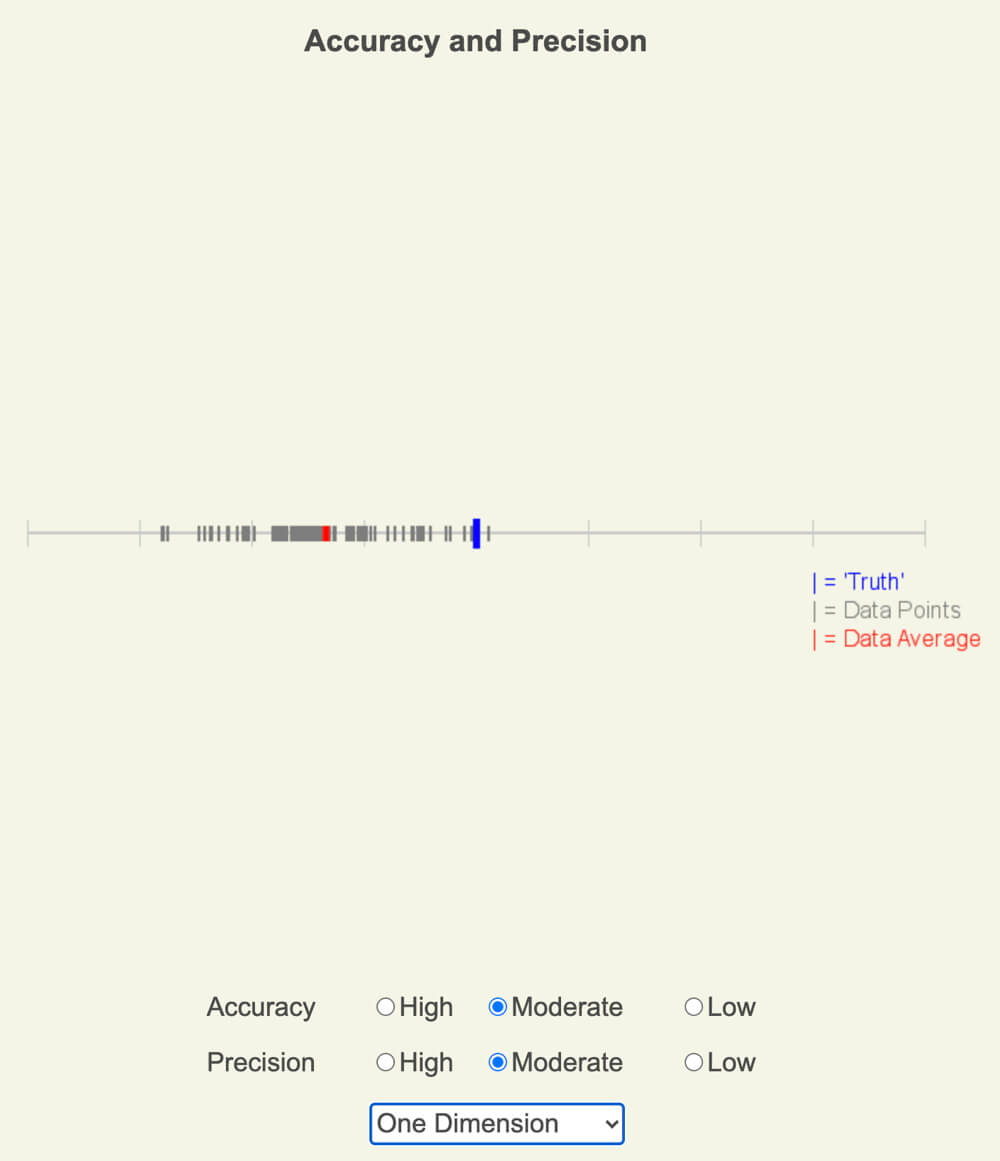
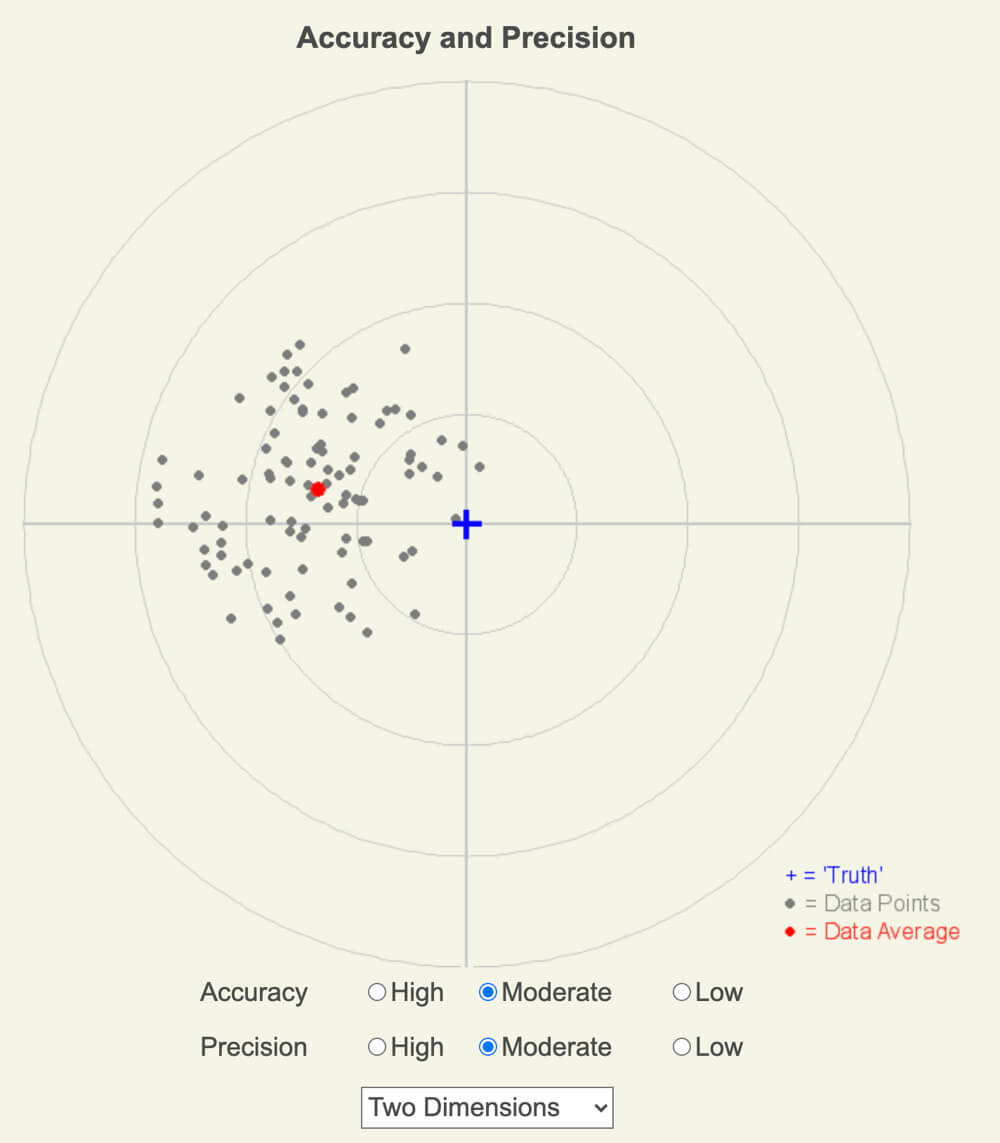
Most people begin working with one-dimensional data: temperature, mass, or length, yet the first version of the Accuracy and Precision app only showed the impact on accuracy and precision on two-dimensional data. The updated app includes how the closeness to truth and repeatability impact one-dimensional measurements.
In the following screenshots of the updated Accuracy and Precision app, both data sets have moderate accuracy and precision. The first represents 100 measurements in one-dimension, and the second representing 100 measurements in two-dimensions.
Working with Imperfect Data
In the vast majority of cases, measured data are not perfect since all measuring devices have limited precision, including our senses as studied with the activities in Our Senses and Brain. So how do we work with imperfect data? If the data are interval or ratio numerical data (introduced in the first paragraph), we use significant figures to represent the precision or uncertainty of the measurements.
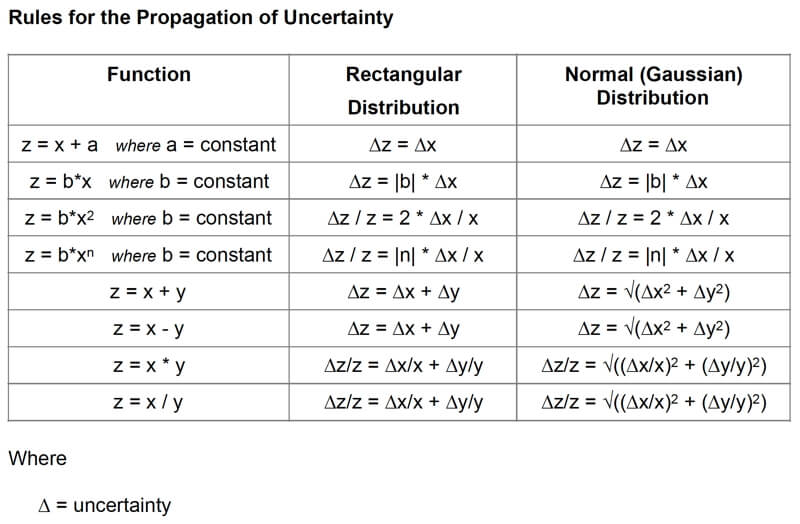
There are rules for mathematically manipulating data with significant figures, which are important to know how the imperfections grow with each calculation. For an overview, see the three webpages at Purplemath starting with the first. A more detailed study of how uncertainty propagates with mathematical calculations, see Vern Lindberg’s article, and this is my summary of the mathematical rules for instrument precision based on significant figures and when determined by multiple measurements.
Science, Technology, and Measurements
As stated on the Technology page, there is a positive feedback process between science and technology, where each advances the other. Two of the mechanisms that advance both science and technology are the collection and analyses of measurements, which, in turn, improve and expands the need for measurements, especially numerical ones. It is no wonder why we are in the Information Age.
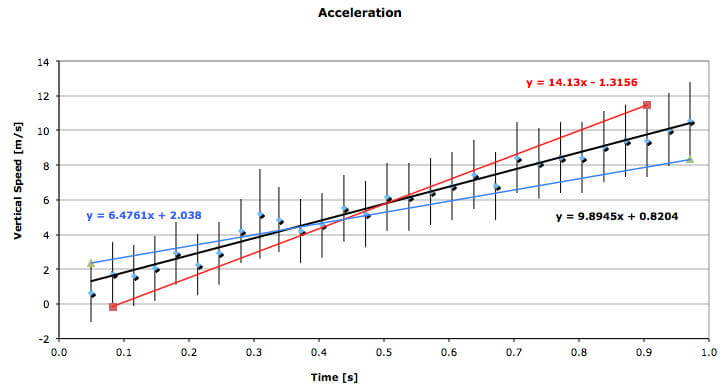
The positions of a falling ball in a digital movie provided a value of the acceleration of gravity that was quite close to the actual value of 9.8 m/s/s (black line). But when the uncertainty of the data was considered, the range of possible values was roughly 50% above and below the actual value (red and blue lines). Is there a better way to measure g that has more precise observations?
Topics in Observing
- Our Senses and Brain
- Perspective,
- Technology,
- Measurement,
- Data, Graphs, and Functions
- Function Transformations
- Contouring, and
- Improving Observational Skills.
Measure your:

0 Comments