Get to Know Desmos
You have some experience with Desmos now, but we need to dive deeper into how to make changes in the software while learning about two key elements in math modeling:
- Finding and fixing errors (commonly called debugging) to get them to work correctly, and
- Building from small steps that are checked to make a working larger set of steps (a precursor to a model!).
Fix It Activity: Why Aren’t They Equal?
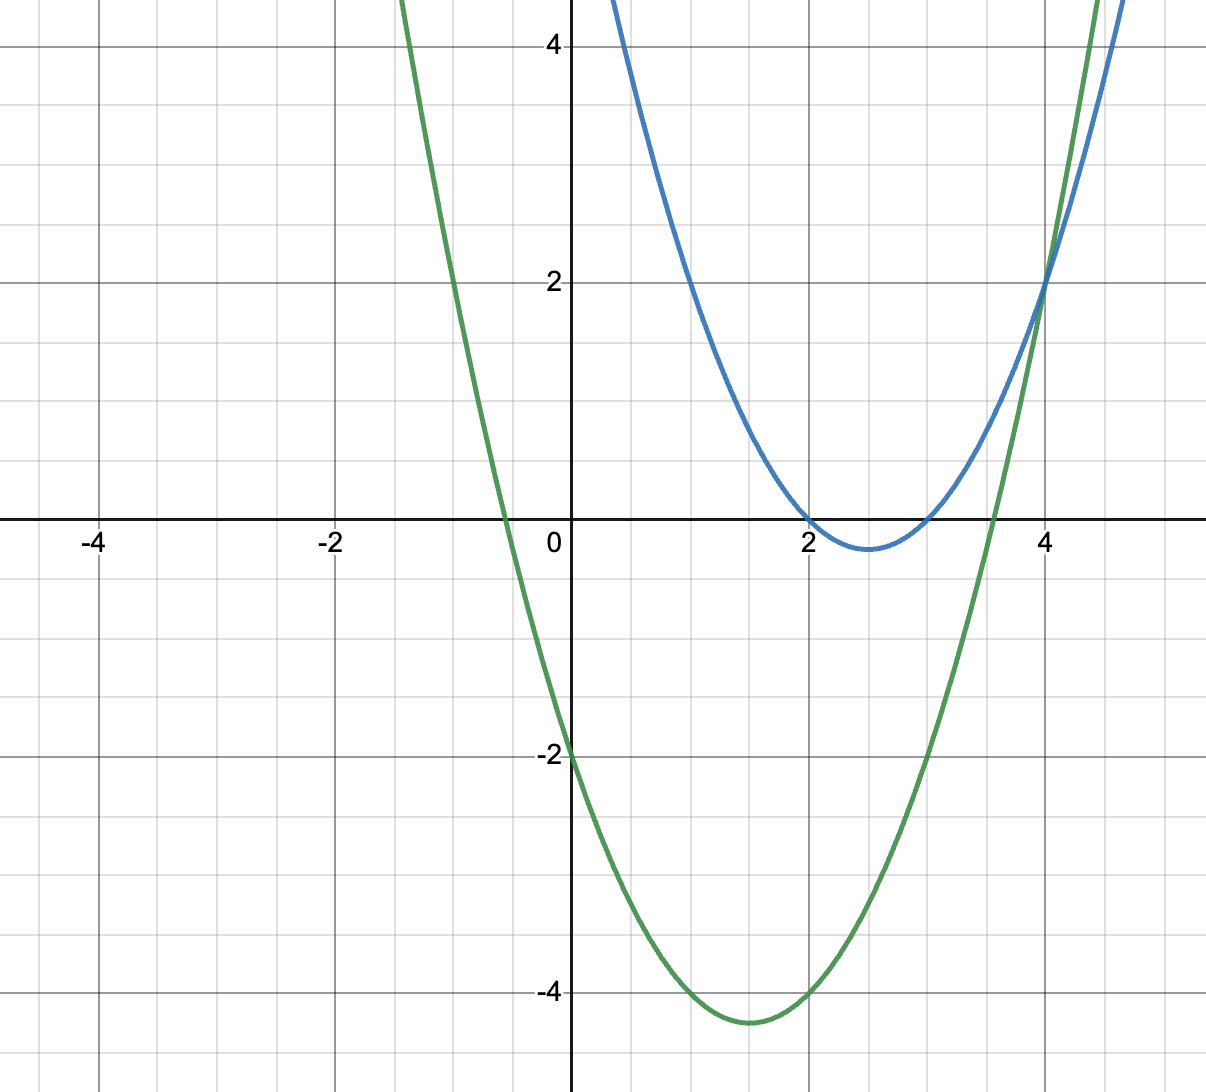
Click on the image on the right to open the Desmos activity showing two parabolas. Fix it so both equations produce the same parabola.
Answer
This is the case of missing parentheses – one of the most common errors in math!
Factoring x²-5x+6 produces (x-3)(x-2).
Fix It Activity: Shouldn’t this be a Parabola?
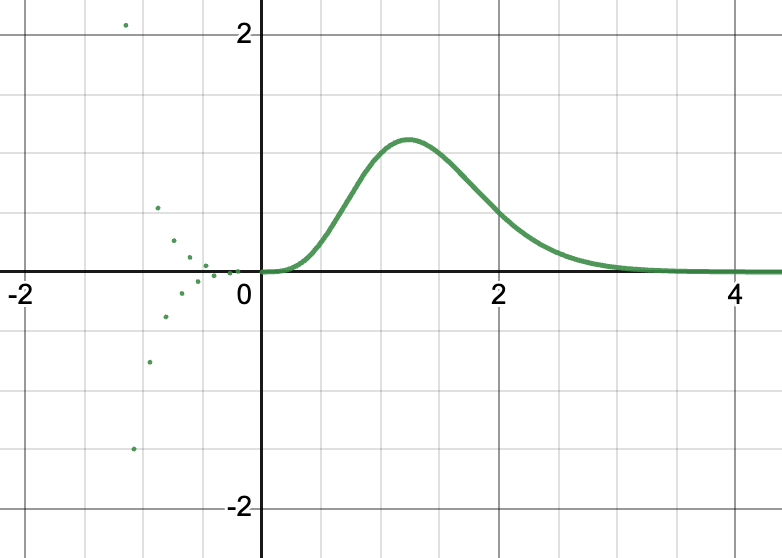
Click on the image on the right to open the Desmos activity showing one equation and its graph. Fix it so the equation produces a parabola.
Answer
This is the case of missing that when one enters a superscript in Desmos, you must exit the superscript mode by typing the “right” arrow.
To produce the parabola, you need
x² – 2x +1
Fix It Activity: Why Aren’t There Two Line Segments?
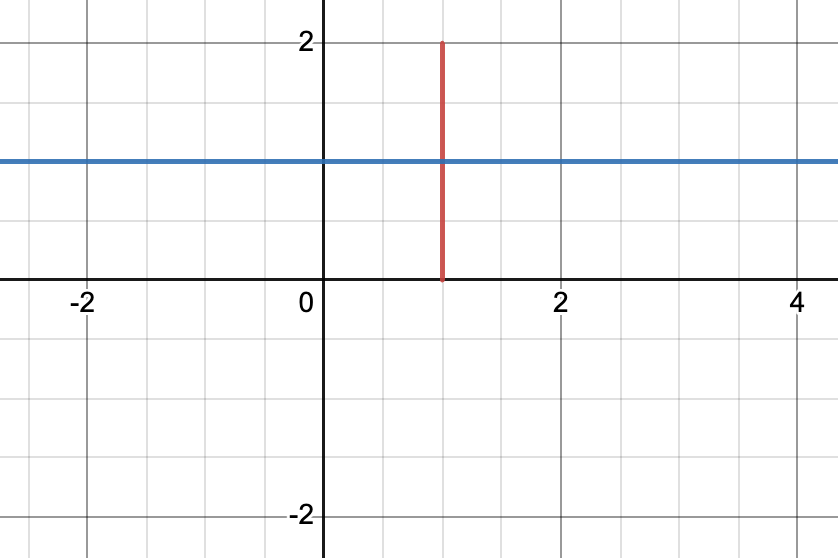
Click on the image on the right to open the Desmos activity showing two equations and their graphs. Fix it so you have two line segments, one horizontal and the other vertical.
Answer
It is easy to get mixed up when working with multiple “x”s and “y”s.
To fix the horizontal line, use
y=1 {0<x<1}
Small Step Activity: Draw a Box
Math models often have several interacting components, but it is not advisable to create all of the parts before first running your model. Instead, break down a feature into smaller pieces and test each before moving on to the next.
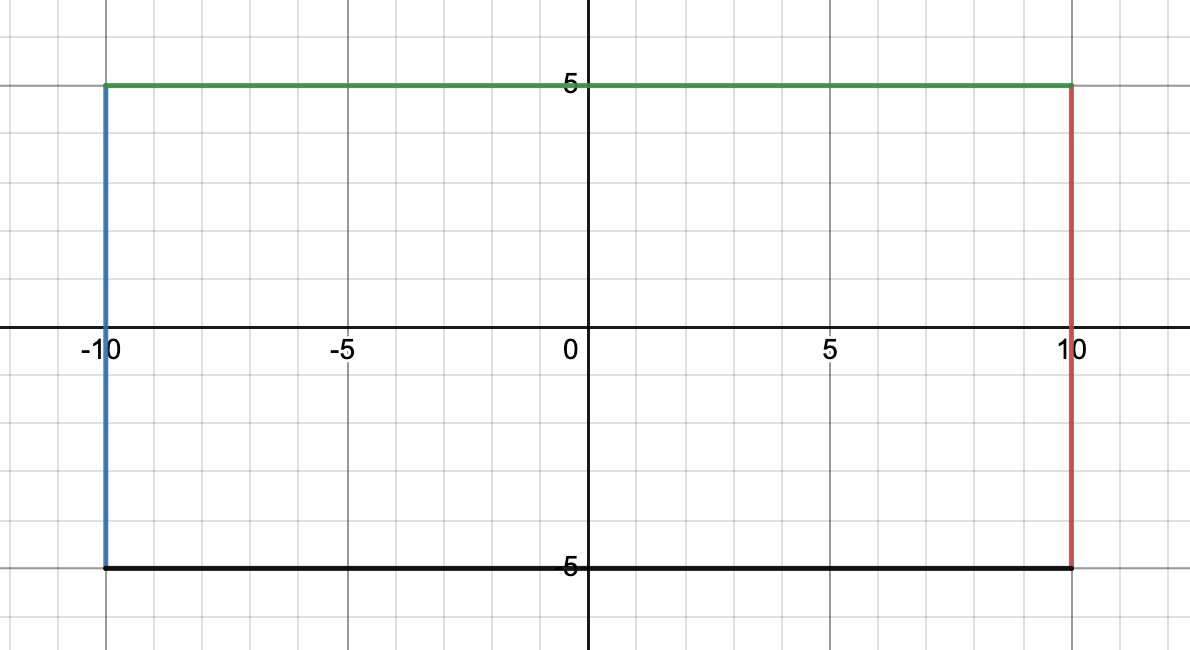
In this activity, you will draw a box using Desmos, but rather than drawing the complete box, draw one side or line segment at a time.
- Open Desmos to create a blank document.
- Draw a blue vertical line going through the origin.
- Draw a blue vertical line segment 10 units long centered through the origin.
- Move the blue line segment 10 units to the left of the origin but centered across the x-axis.
- Create a red second line segment, 10 units long, centered across the x-axis, and 10 units to the right of the origin. Tip: copy and paste the equation that created the blue line segment to save time and minimize typing errors.
- Connect the two vertical line segments with horizontal lines (one green and one black) that create a rectangle. Tip: copy and paste once the first vertical line segment is correct to help quickly make the second.
Why use the color for each line segment? It helps to know which equation you are working with when creating the lines. You can quickly change the line segments to one color when you are done.
Check your answers by clicking on the graph or clicking here.
Small Step Activity: Moving Your Box
The sliders in Desmos provide wonderful interactivity to see the impact of changing variables and how they interact.
1. Create a slider to move the rectangle you drew in the previous activities horizontally. The rectangle needs to remain coherent as it moves.
2. Create a second slider to move the rectangle vertically.
3. Create a third slider to move the rectangle 45º, or along the y=x line.
Check your answers by clicking on the graph or clicking here.


