Modeling Stopping a Car
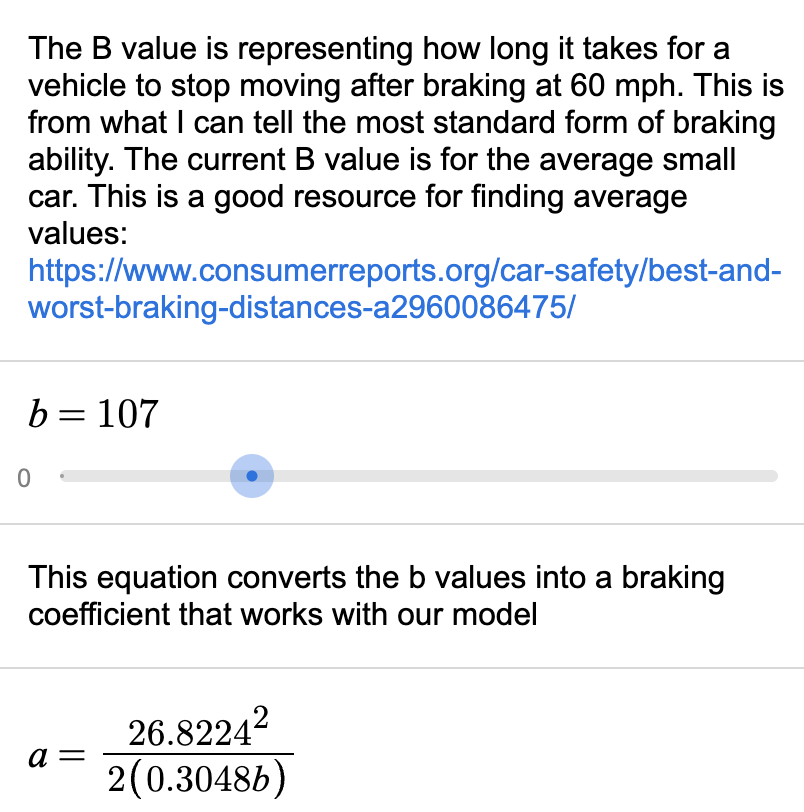
It is February 2023, and our first snowstorm to disrupt school happened yesterday, so what better way to use a model with new and future drivers to explore stopping a car? How far will a car travel when you consider the car’s speed, the driver’s reaction time, the slope of the road, and how much acceleration the car’s brakes can create? There are many things to consider, and it helps to develop experience by driving or exploring a model.
To begin, create controlled experiments to see what makes the shortest and longest braking distances. This means changing only one variable at a time. Record your experiments to find the most and least significant variables in controlling stopping a car.
There are two models to select from:
1) A model in which a slider controls the acceleration of the car, and
2) A model in which the amount of friction between the tires and the road control braking.
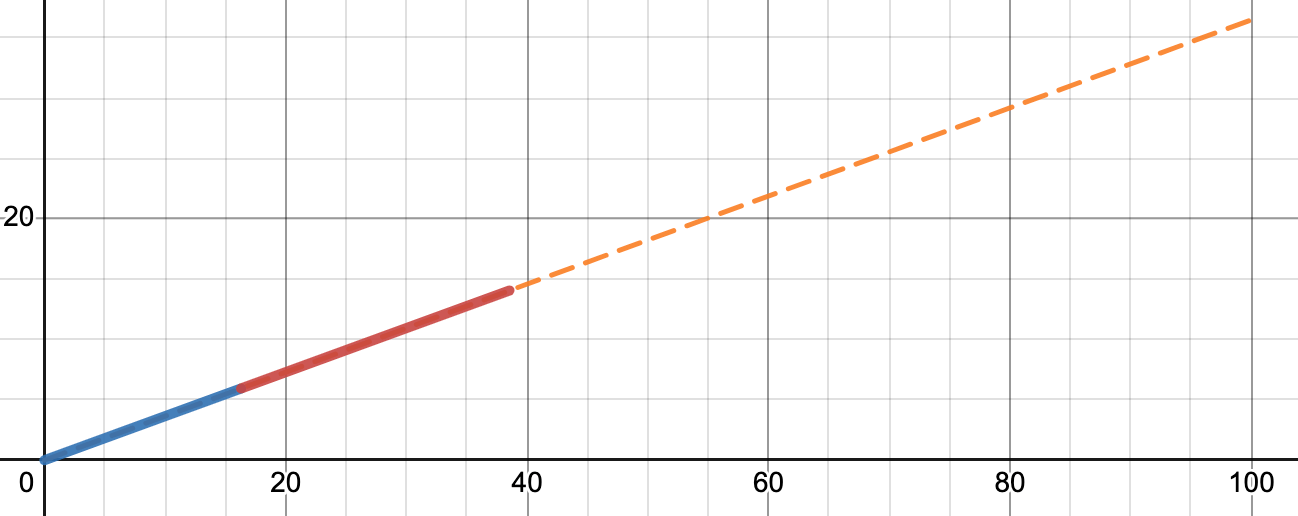
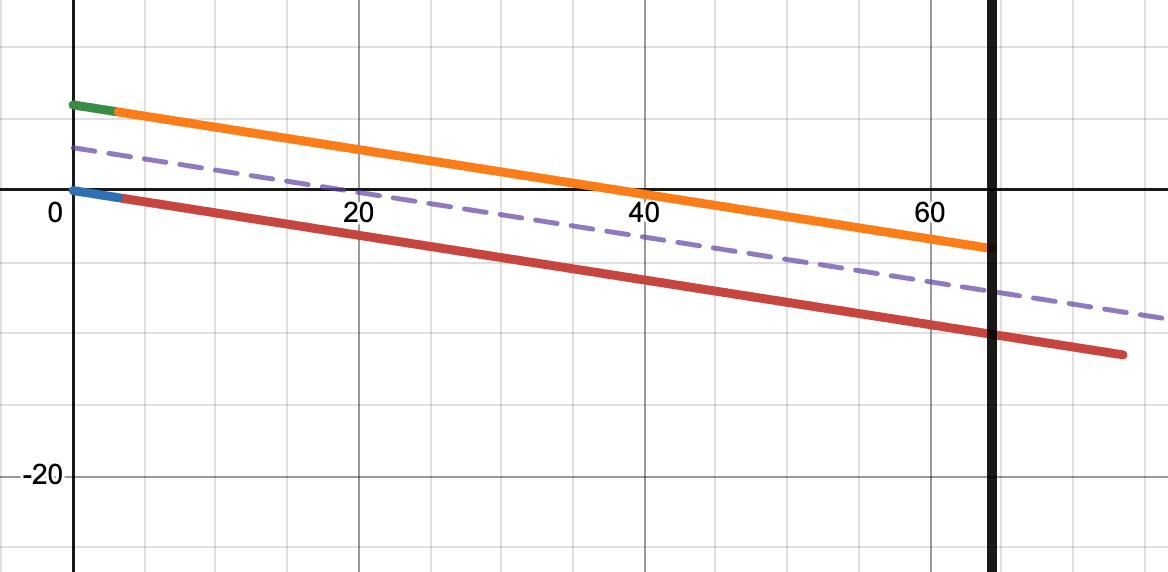
An example of how a car brakes going up an incline. The blue line is the distance traveled while the driver tries to respond to push the brakes (reaction time), and the red line is the distance the car travels after the brakes are pushed and when it stops.
The Math of Stopping a Car Traveling Horizontally
Stopping a horizontally traveling car is the most straightforward to mathematically model since gravity only acts in the vertical direction.
Let v = the car’s velocity, a = acceleration created by the car’s brakes (assumed constant), x = distance traveled after the brakes are pushed, and t = time since the car’s brakes are pushed, then
x = v t – 0.5 a t²
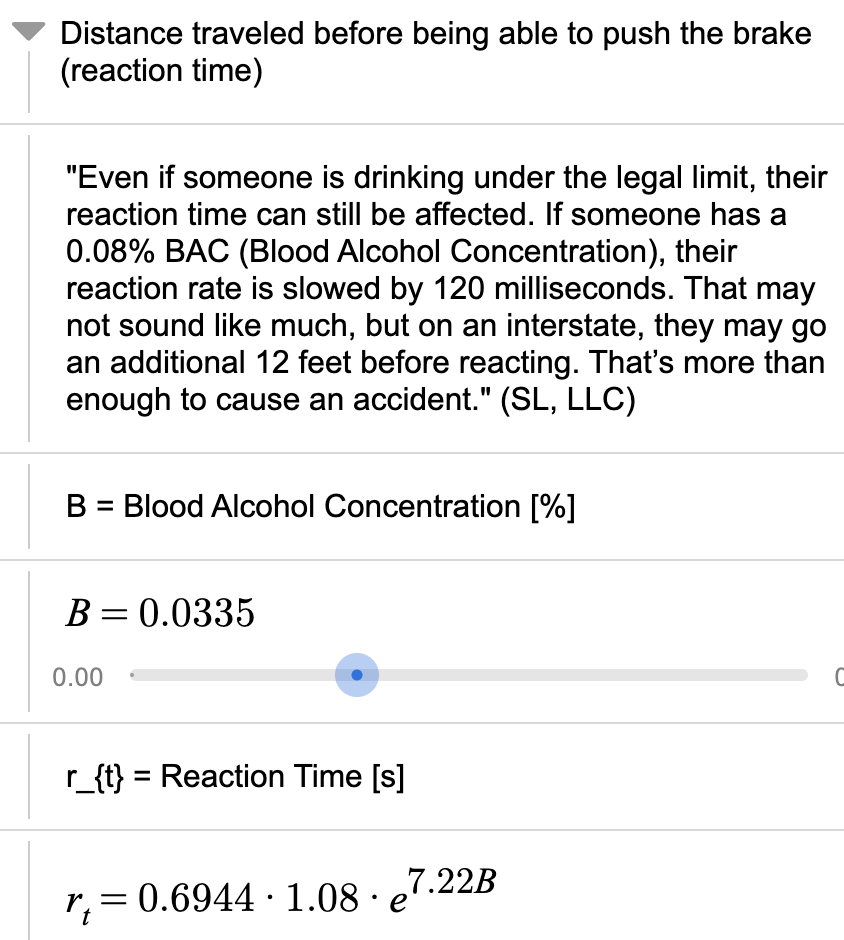
But we also need to consider how long it takes a driver to recognize that they need to push the brakes and when they do. We call this reaction time. We will assume that the car travels at a constant speed until they push the brakes, then
x = v * reaction time
We must add both to have a more representative car-stopping model, especially under dire conditions.
Use a Yardstick to Measure Reaction Time
This is a fun activity to do in the classroom. Have students hold their hands roughly 6 inches apart with a vertically held yardstick between them. Line up the top of their hand at the one-foot mark. Drop the yardstick and measure how far it falls before they catch it. To make it more entertaining, drop it again, but this time intentionally talking and distracting them. It is remarkable how much farther the yardstick falls.
Let Δy = distance the yardstick falls in feet, and g = 32.17 feet/second², then
reaction time = √(Δy/g)
Typically, students had a reaction time of roughly 0.15 seconds.
The Math of Stopping a Car Traveling on a Slope
Earth’s gravity always pulls objects vertically downward toward the center of the Earth, so when a car travels on a slope, part of gravity has a component that pulls the car along the road. When a vehicle travels uphill, gravity pulls the car in the opposite direction it is traveling, and when traveling downhill, gravity pulls the car in the direction it is traveling.
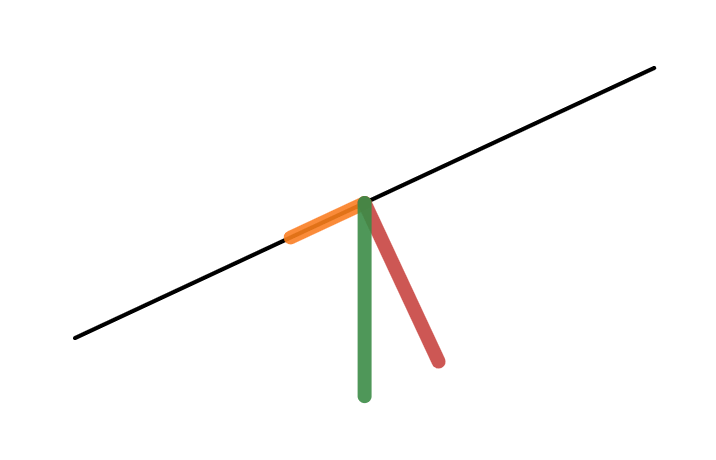
When you open the model, the green line represents the pull of Earth’s gravity, the orange line represents the component of gravity parallel to the road (thin black line), and the red line is the component of gravity perpendicular to the road. Each line points from the center of the image toward the end of the line, and the lengths of the lines represent the magnitude of the pull.
Combining Braking and Gravity to Stop a Car
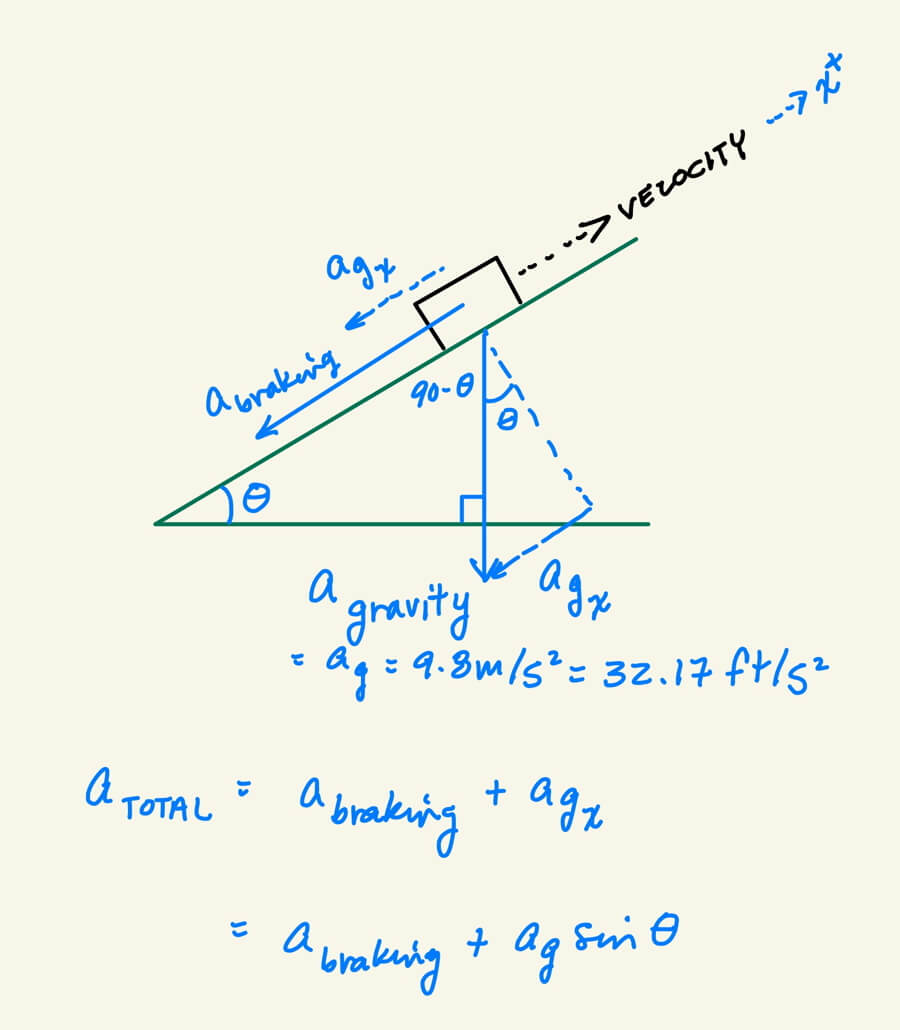
The drawing on the right shows the acceleration acting on a car uphill as it brakes. The slope of the hill is shown as θ, and the axis parallel to the road is positive in the uphill direction. The acceleration of braking is in the opposite direction of the car’s velocity, so it is negative. The acceleration of gravity parallel to the road is also in the direction of braking, so negative.
The combined acceleration, or total, is the sum of the two accelerations:
a(total) = a(braking) + a(gravity parallel to the road
or
a(total) = a(braking) + g sinθ
where g = 9.8 m/s² = 32.17 ft/s²
Using one of the kinematic equations of motion:
v(final)² = v(initial)² + 2 * a(total) * distance traveled
Since we are stopping, v(final) = 0 and a(total) < 0, then
0 = v(initial)² – 2 a(total) * braking distance
Isolating braking distance yields
braking distance = v(initial)²/ (2 * a(total))
The Math of Stopping a Car with Friction
When we consider friction, a car’s braking is not just a constant value, as we used above. It depends on the force the car exerts perpendicular to the road, which is equal to the force of the road pushing on the vehicle (called the normal force). In the earlier Desmos model, the magnitude of the normal force is proportional to the length of the red line. When the road is horizontal, the red line is the longest, and as the road gets steeper, the red line gets shorter – and the magnitude of the normal force decreases.
Friction from braking = Normal Force * Coefficient of Friction
or
Friction(braking) = Car Mass * g * cosθ * Coefficient of Friction
Where friction only acts parallel to the surface.
Now we can substitute Friction(braking) for a(braking) above in the a(total) equation. Now we have a more realistic model – and it turns out that the vehicle’s mass is canceled out in the final formula.
Challenge: Modify the Braking Model
Modify one of the two existing car braking models to add an aspect you want to explore.
Several student works are shared. Try them out by clicking on the screenshot of each and learn how to drive more safely! I found the range of their ideas inspiring, and it reinforced the point that starting from a basic idea allows more sophisticated concepts to flourish!
Toby Clackson mathematically and visually compared the stopping distances of cars with different braking systems: anti-lock braking and those without.

