
Software
Design Philosophy
Many of the original desktop software that required downloading and installing on your computer are being rewritten to web apps, which means the application runs on your web page. No more downloading! Just click the web app’s button and a new webpage running the app opens. But when speed and complex calculations are needed, desktop apps will be used.
There are four types of apps on this website:
- Simulation: visually and numerically explore a concept by changing its variables. Explore how the changing parts interact.
- Practice: create an unlimited number of practice problems to solve. Visual, numerical, written, and mathematical feedback are provided.
- Tools: explore a phenomenon by collecting data measured with the app. Design research-quality experiments with the tools or explore a topic without competition.
- Games: apply your knowledge and skills through a series of challenges. Visual and written feedback provided.
Note: Each version of a web app has a unique URL, so don’t bookmark this, instead bookmark the webpage that contains the web app. Links to past releases will be deleted one day after posting a new version.
The web app opens in its own page/tab so that the webpage that introduces it remains available. These webpages have supporting information and provide a context to best use the web app. Desktop apps are designed only for larger computer screens (desktops to and tablets), as are most web apps. Several web apps have been upgraded to include a version for smartphone screens.
Learning Through SWAGs
Being a meteorologist in the Air Force, I applied fundamentals concepts to new scenarios. Pilots would frequently ask, “Is that your WAG or SWAG?”. Wild-Ass Guess versus Scientific Wild-Ass Guess!
We all need practice applying what we already know to situations we’ve never seen before (to SWAG!). There is positive feedback (feedback that amplifies the response to a change) to our learning when we try to apply our knowledge. The open-ended nature to many of the software activities allows you to test your SWAG. Explore your “why” and “how” questions that arise when surprised with the results of a simulation.

WHAT YOU GET
Self-Generated Visuals: Study complex spatial relationships through visuals created by changing a range of variables.
Layered Visualizations: Turn visual information on and off or change its appearance to see new patterns and integrate layers of information into your analyses.
Interactivity: Change variables to your heart’s content to explore complex processes and systems. Okay, not all of the variables found in nature, but there are many to get you started.
Graphs and Data Analysis: View data trends of scenarios you created to help answer your questions.
Explore “What if” Scenarios: Science has so many unanswered questions, and they are often discovered by starting with “What if?”
Save Your Work: Teachers, save high-resolution graphics to create homework questions, solutions, answer keys, and test questions. Students, save your work to include in research papers, homework responses, or a notebook of ideas.
Web Apps
Click on a link or the screenshot to go to the webpage hosting the app. Use the directions, supporting information, and suggestions to augment your experience with the app.
To run a web app, click on the blue/green shaded button. Once clicked, a new window opens that runs the app.
To run a web app designed to fit a smartphone screen, click on the purple/black shaded button. Once clicked, the app runs on your smartphone.
Web App Title
App Type and Link
Description
Screenshot
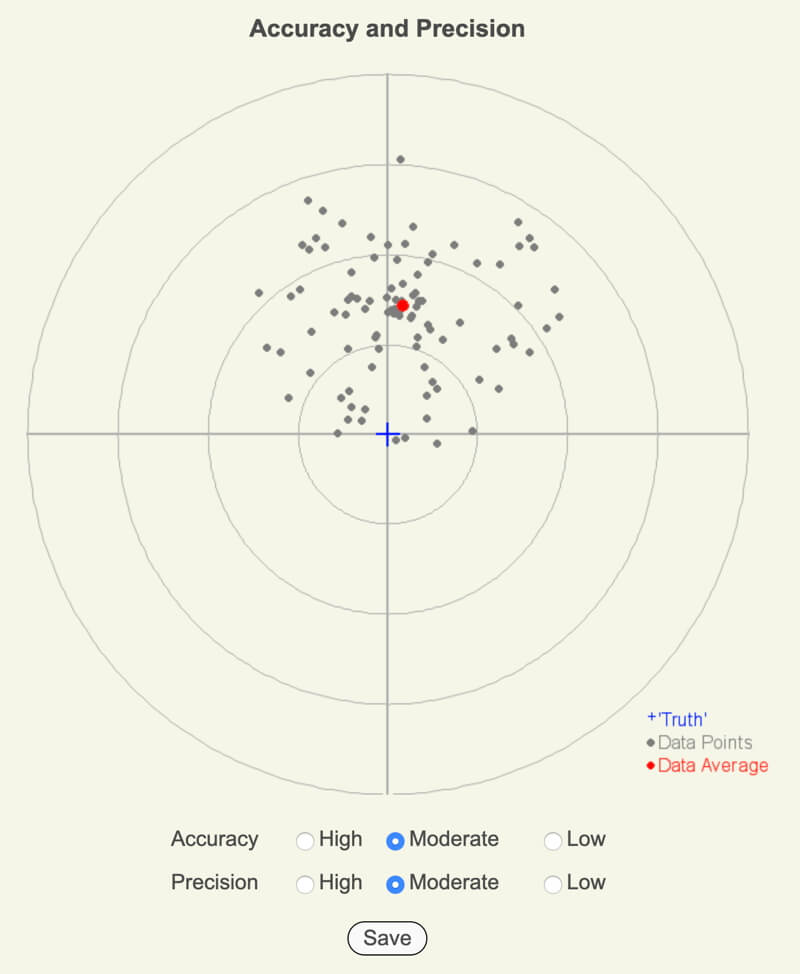
Accuracy and Precision
Simulation for Measurement in Observing
There are two versions of the web app—one for smartphones and the other for larger screens (desktops, laptops, and tablets).
Change the degree of accuracy and precision and a randomized data field is plotted.
Adding Vectors
Practice for Adding Vectors in Earth Systems.
Try the unlimited number of practice problems adding 2 or 3 vectors graphically or mathematically. Visual and numeric feedback are provided for each problem.
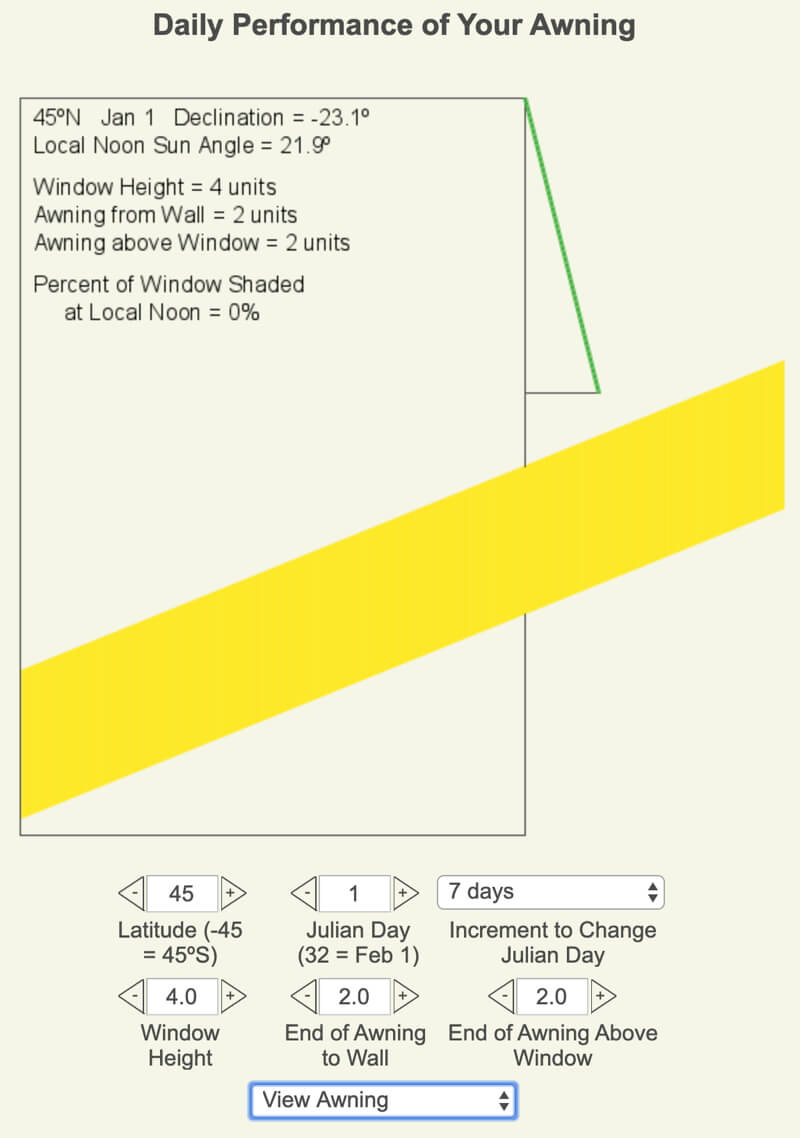
Awning Design
Tool for Using Declination Circles in Earth Systems.
Design an awning to block summertime sun from entering a window but allow the sun to enter during the winter months. Test its seasonal performance for a given latitude.
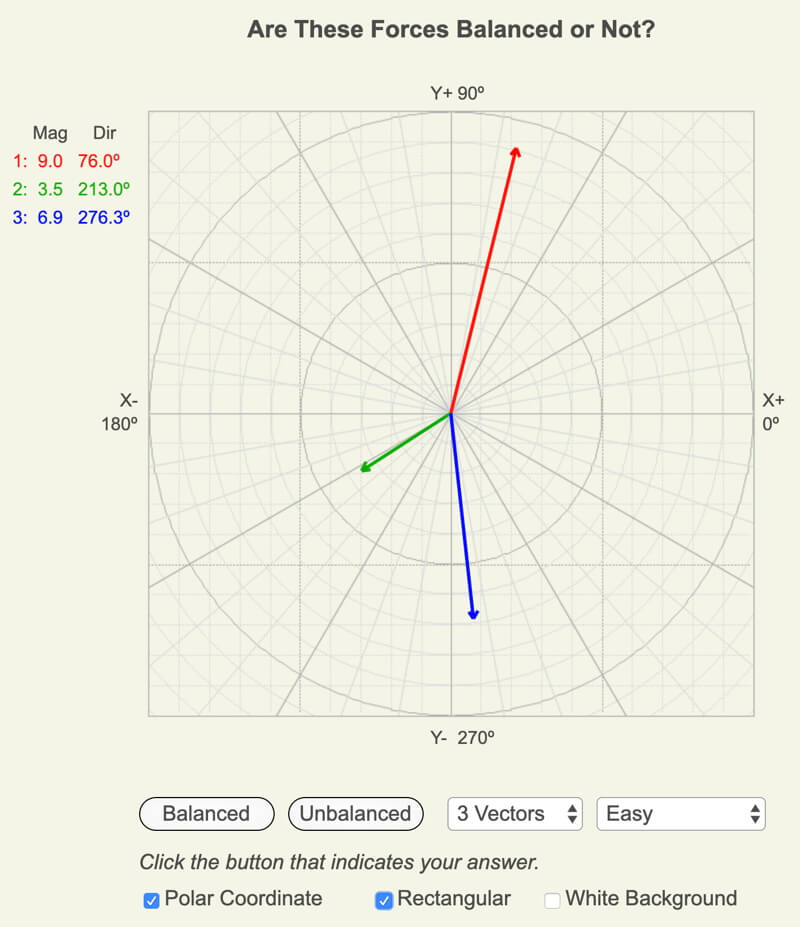
Balanced Forces
Practice for Vectors and the Laws of Motion in Earth Systems.
Analyze the unlimited number of practice sets of 3 or 4 force vectors to decide whether the set of force vectors are balanced or not. The “easy” setting stresses adding vectors graphically, and the “challenging” setting focuses on calculating and adding vector components mathematically.
Beam Concentration
Interactive visualization for Sun Angle and Beam Concentration in Earth Systems.
Visualize how a beam of sunlight spreads out along level ground as the sun’s angle to the horizon changes.

Calculating Twilights
Interactive simulation for Sunrise, Sunset, and Twilight in Earth Systems.
Explore how the timing and duration of the three stages of twilight change with latitude and season.

Color Change
Tool for Color Vision in Observing
Two versions are available: one for tablet screens and larger and the other for smartphones.
Measure your sensitivity to changes in red, green, and blue intensity. Complete 10 randomly generated challenges and compare your results to those who have completed the activity before you.

Color Difference
Tool for Color Vision in Observing
Two versions are available: one for tablet screens and larger and the other for smartphones.
Measure your sensitivity to differences in color by identifying the shape that appears as it incrementally changes color from the background. Complete 15 randomly generated challenges to explore your color vision across a large spectrum of visible colors while comparing your results to others who have completed the challenges already.

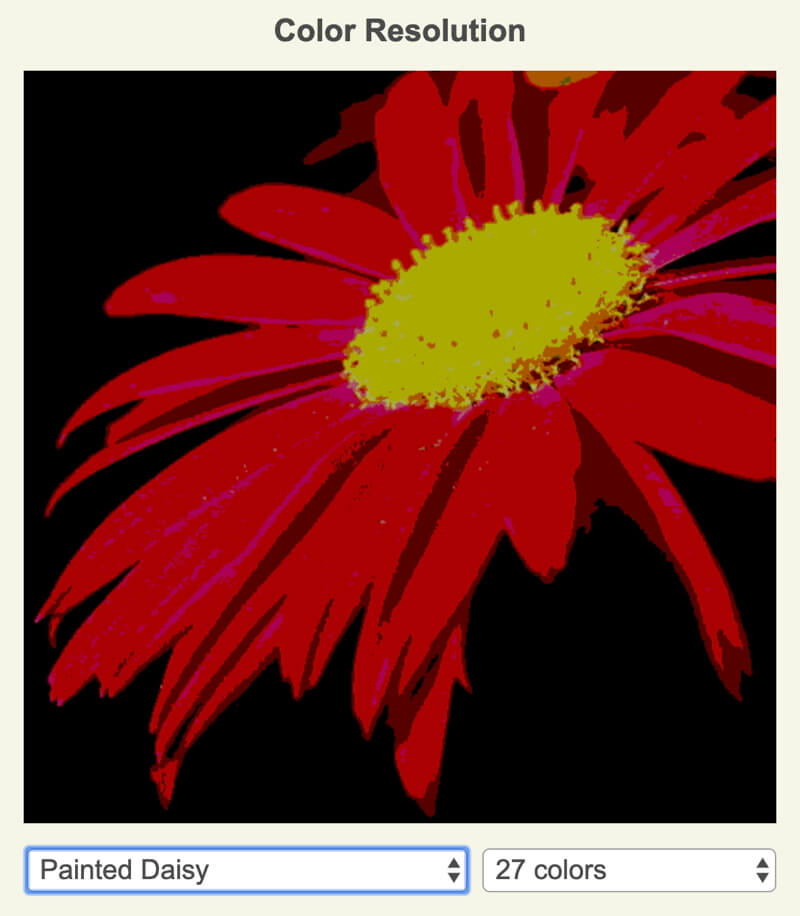
Color Resolution
Simulation for Color Vision in Observing
Explore how the world would look like with one of the most primitive color visions to just beyond what humans can see by viewing the same scene with fewer colors.
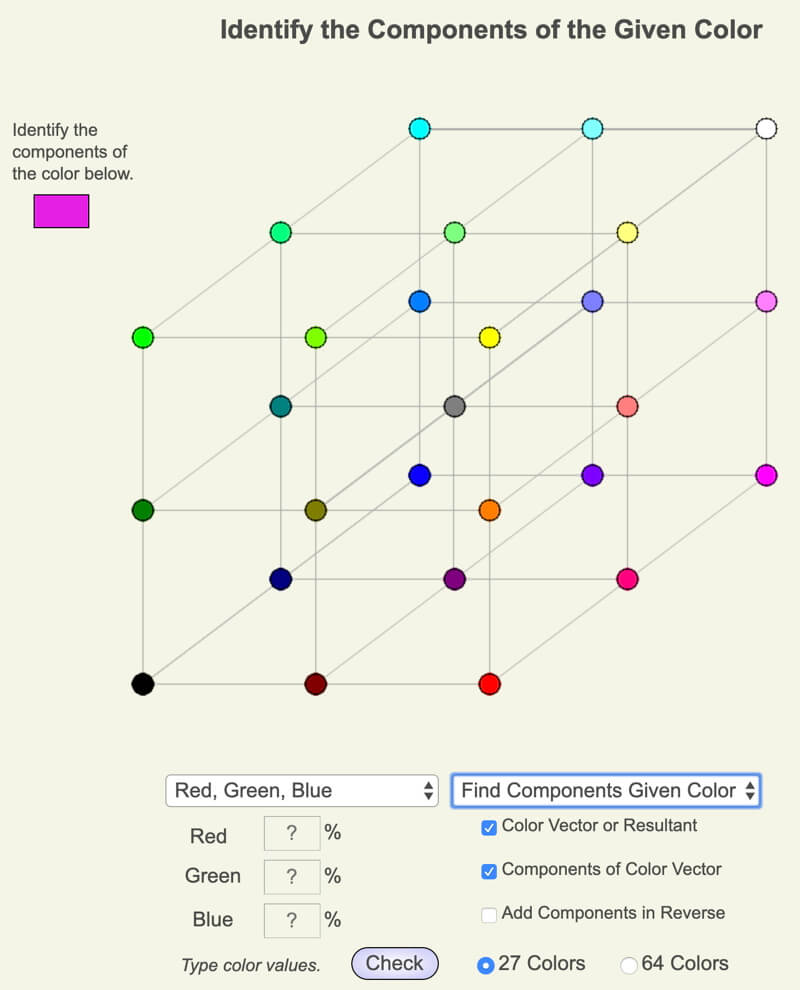
Color Vectors
Upgraded August 20, 2020.
Simulation and Practice for Color Vectors in Earth Systems.
Interactively navigate two worlds of color. Explore how color components define a color using the simulations, and practice identifying the RGB or CMY for a given color and the color when given its components.
Improvements include quizzes to earn certificates of accomplishment, improved interactivity of the color spaces by clicking on the color axes or selecting a color ball, and levels of difficulty in identifying colors from color components.
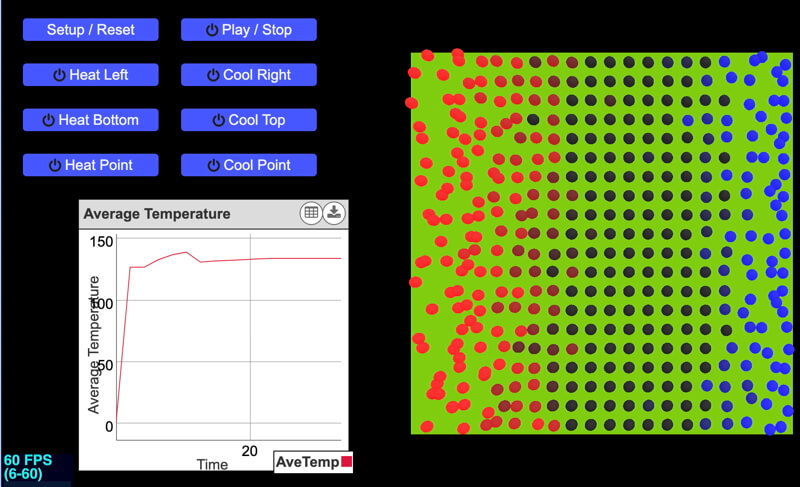
Conduction Experiments
Simulations for Conduction in Earth Systems.
Explore a model of heat conduction in a solid. Create a temperature gradient in a variety of orientations and magnitudes by either heating and/or cooling parts of the solid square.
Convection
Simulations for Atmospheric Convection and the Ideal Gas Law in Earth Systems.
Explore a key mechanism that transports heat from the Earth’s surface warmed by sunlight into the atmosphere.
The Convection web app has:
- 8 starting temperature profiles.
- 2 options to heat the ground:
- Pause after the convection cell grows vertically.
- Warm the ground at a specific temperature increment.

Practice for Drawing Declination Circles in Earth Systems.
Updated June 18, 2021, to include a quiz mode with minimal guidance while drawing the declination circles. As with the practice mode, there is visual and written feedback on your performance.
The app coaches you through the four basic steps to drawing a declination circle for any latitude and day of the year. There are written and visual hints, tips, and feedback for each step, and you may set the date and latitude yourself or use the random option to challenge yourself.

Earth Illumination
Simulations for Declination, Latitude, and Earth Illumination in Earth Systems.
To understand how Earth is illuminated by the Sun, start by viewing the Earth from space. The app has four visualizations for each month of the year:
- The solar declination,
- The astronomical seasons,
- The degree of illumination between the Northern and Southern Hemispheres, and
- The latitude that experiences the Sun overhead at local noon.

Logic Master
Game for Testing Your Questioning using Logic in Questioning.
There are two versions of the web app—one for smartphones and the other for larger screens (desktops, laptops, and tablets).
Find the secret colors, shapes, and positions of several objects in as few tries as possible. Your guesses provide vital information to solve the challenge. Design your questions to provide unambiguous data when possible.

Questioning Questionnaire
Updated August 8, 2020
Tool for How Do You Ask Questions? in Questioning.
Take a survey on how you develop and answer your own questions. Store your date-stamped answers to your computer.
Updates: New interface and modified questions.

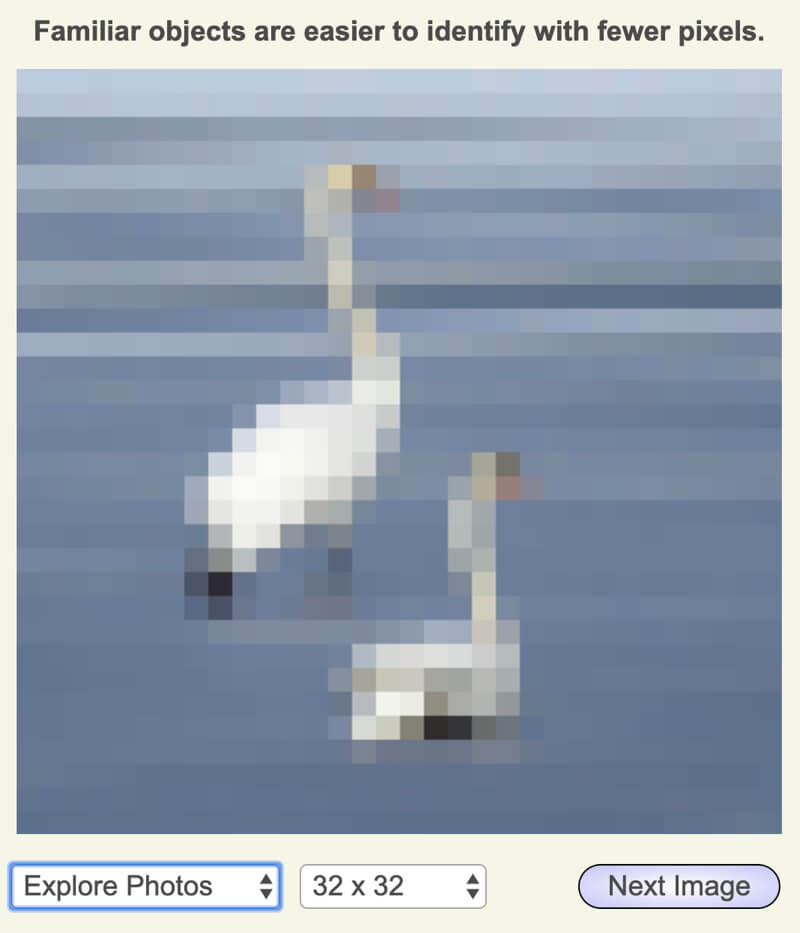
Pixel Resolution
Visualizations and Games for Vision Spatial Resolution in Observing.
Explore how your vision detects objects in images with varying degrees of spatial resolution (the size and number of pixels that make up the image). View how images appear differently or play games of varying degrees of challenge to identify the number and shapes objects being displayed.
Rotate Horizon
Visualization for Drawing Declination Circles in Earth Systems.
Uthe web app to view the horizon and sky grids from changing perspectives. It is important to visualize how the Sun moves three-dimensionally across the sky when viewing declination circles, which are viewed in two dimensions.

Solar Declination
Practice and Quiz for Declination, Latitude, and Earth Illumination in Earth Systems.
The app has three types of activities:
- Explore the connections between day, declination, and change in declination,
- Practice identifying these connections, and
- Quiz mode with less guidance to see how well you understand the connections.

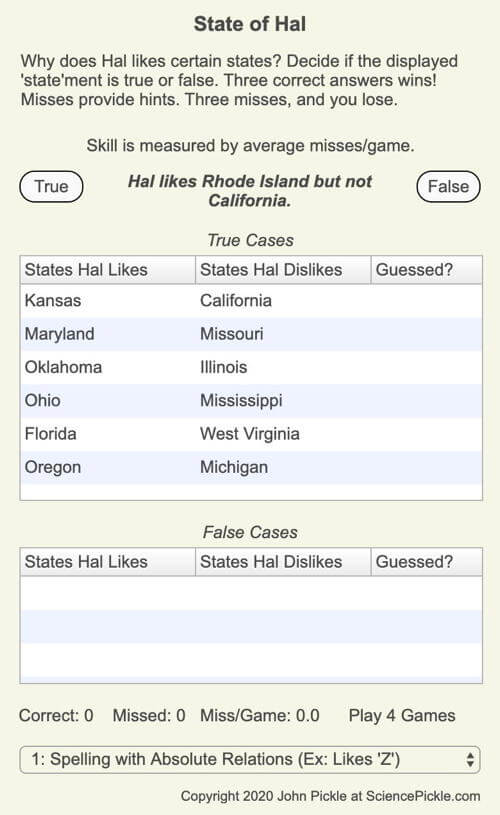
State of Hal
Game for Testing Your Questioning Using Patterns in Questioning.
There are two versions of the web app—one for smartphones and the other for larger screens (desktops, laptops, and tablets).
Identify the patterns in the state names that Hal likes and dislikes. There are five game levels.
Game 1: Absolute letter relationships in the state names.
Game 2: Relative letter relationships in the state names.
Game 3: Both absolute and relative letter relationships are possible.
Game 4: Patterns based on geography.
Game 5: Absolute and relative letter relationships and geographic patterns are possible.
Sun and Your Horizon
Interactive visualizations on the overview page of the Sun-Earth Connection section in Earth Systems.
Explore the illumination patterns on Earth at different latitudes and times of the day throughout the year and for different locations with interactive visualizations.

Sun Angle and Direction
Simultion for Solar Time, Angle, and Direction in Earth Systems.
Explore the connections between the day of the year, laitutde, solar time, and sun angle and direction.
Explore how to use declination circles to calculate the Sun’s position at any solar time anywhere in the world on any day of the year. Connect latitude, day of the year, solar time, and sun angle and position, so if you know four of the variables, you may calculate the fifth! A declination circle is the Sun’s apparent path across the sky, and the easiest one to draw is when viewing the Sun’s motion from exactly west looking east. The path of the Sun appears to move in a straight line, which is easy to draw with a ruler. Use the web app to learn how to interpret these declination circles to identify the date, the solar declination, and the latitude.

Sun Day Challenges
Simulation for Declination, Latitude, and Earth Illumination in Earth Systems.
The app has three types of activities:
- Explore.
- Practice.
- Quiz.
A declination circle is the Sun’s apparent path across the sky, and the easiest one to draw is when viewing the Sun’s motion from exactly west looking east. The path of the Sun appears to move in a straight line, which is easy to draw with a ruler. Use the web app to learn how to interpret these declination circles to identify the date, the solar declination, and the latitude.

Sun Time Challenges
Simulation for Interpreting Time on Declination Circles in Earth Systems.
Practice estimating time on a declination circle. A declination circle’s length and orientation depend on the location’s latitude and the day of the year, so practice estimating time on declination circles between 89ºN and 89ºS for any day of the year.

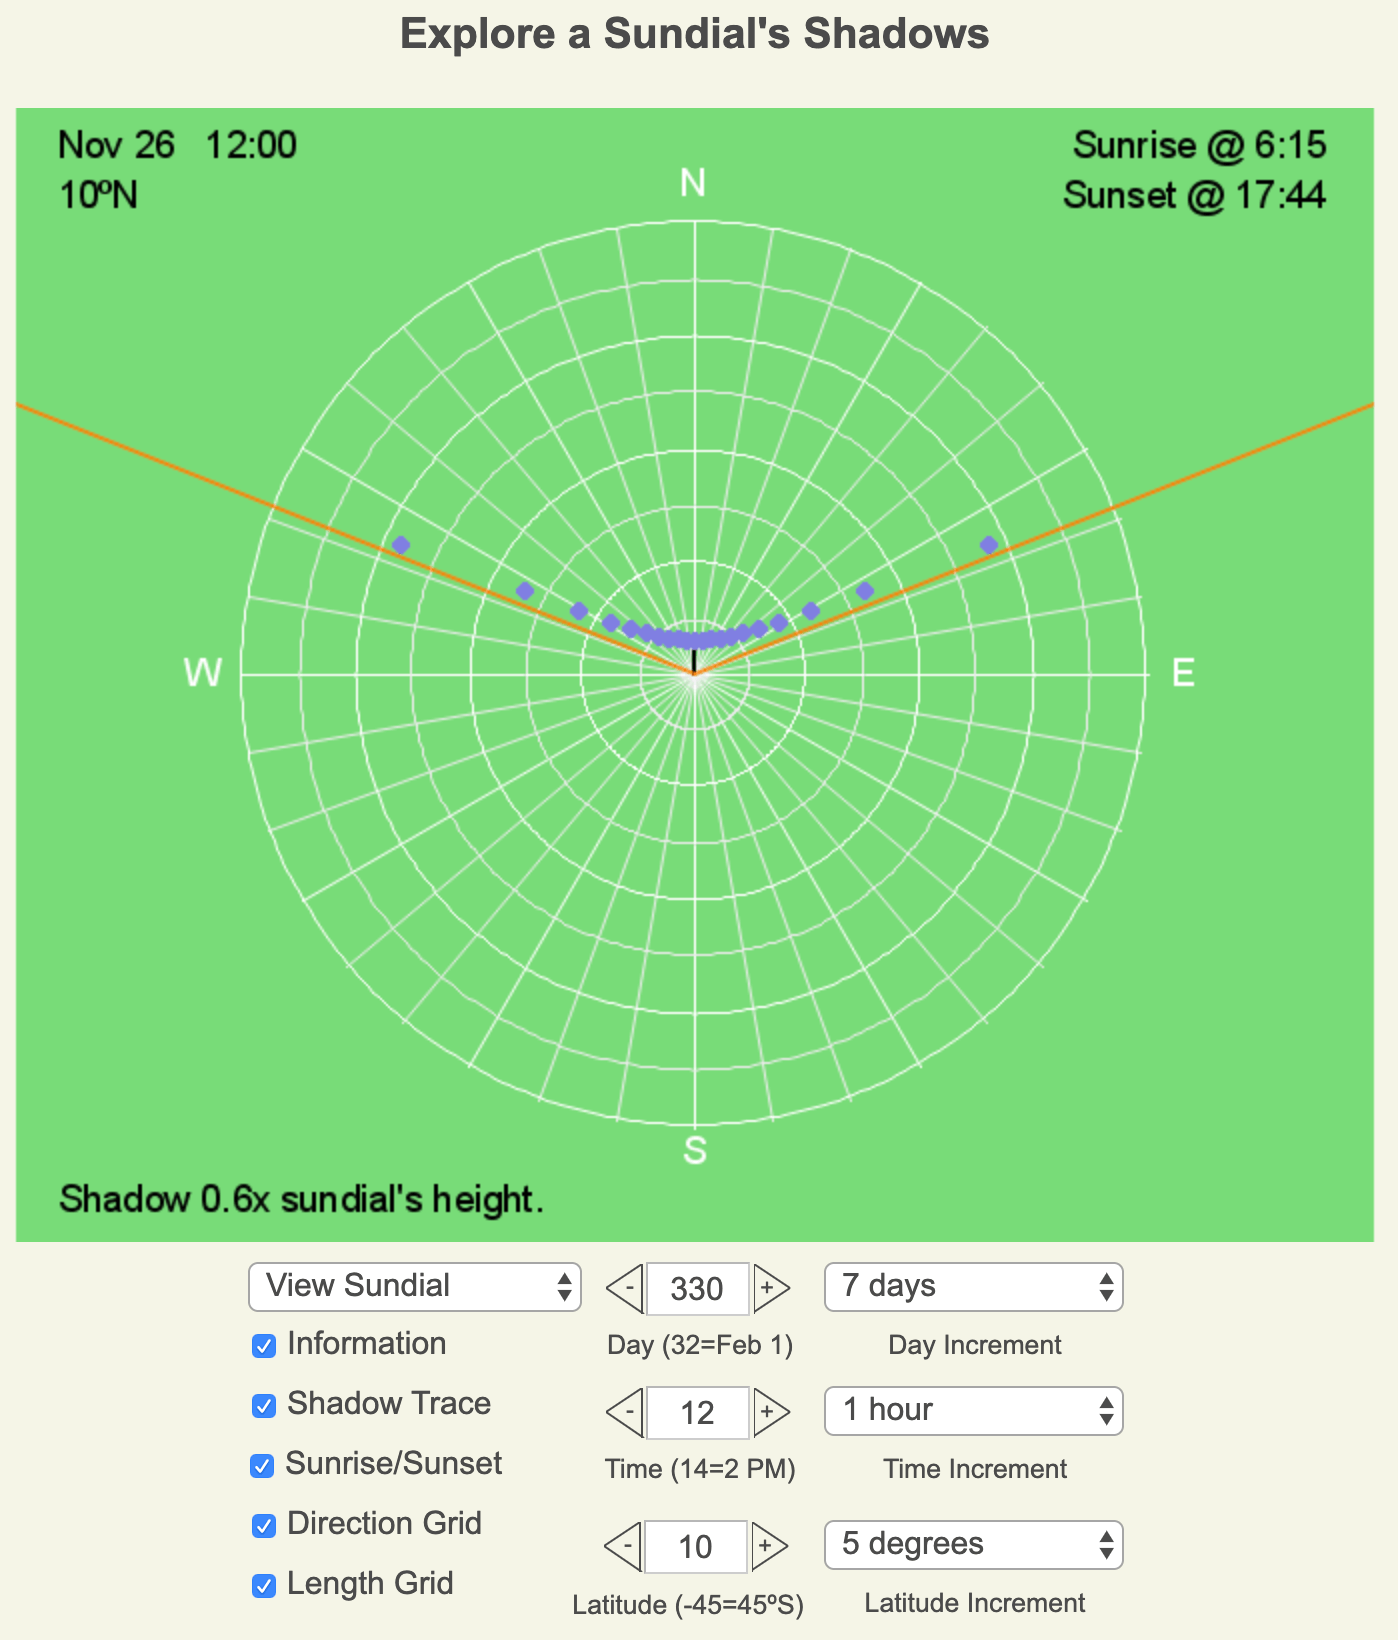
Sundial Shadows
Simulation and Practice for Using Sundials and A Sundial as a Clock, Compass, and Calendar in Earth Systems.
The Sun rises east twice a year – at other times, it may be from quite a different direction! So how do shadows change throughout the day and year? How will the daily shadow patterns be different when you travel? Explore a vertical sundial’s shadows at any location, date, and time of day.
Suzie the Artist
Game for Testing Your Questioning with Numerical Data in Questioning.
There are two versions of the web app—one for smartphones and the other for larger screens (desktops, laptops, and tablets).
Examine various numerical clues to identify Suzie the Artist’s pattern used to pick her 6 colors each day. Use the first 5 to identify the 6th using the patterns in the color intensities. You have 3 tries per game. Three wins move you up a game level, and there are 6 levels of difficulty.

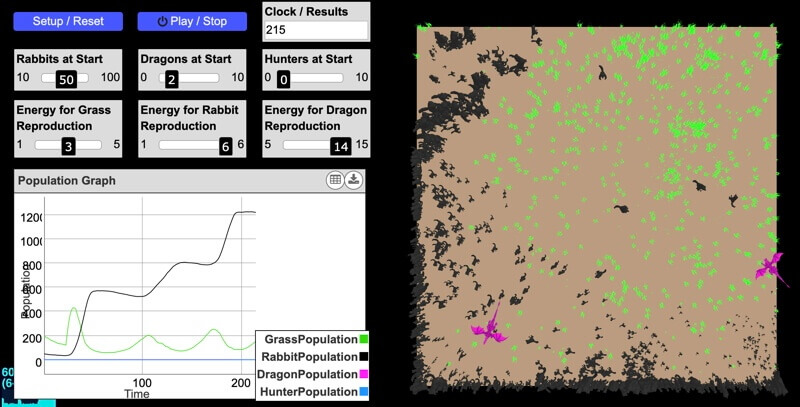
System Model
Simulation for Systems in Earth Systems.
Time Declination Circle
Simulation for Interpreting Time on Declination Circles in Earth Systems.
Explore the hourly position of the Sun on declination circles. When we view a straight line, we often assume that change is constant, but that is not the case for the Sun’s position on a declination circle when viewed from the side. When creating a declination circle by hand, we draw this view first since it is easiest to draw.

Times and Durations of Sun Angles
Interactive spreadsheet (Google Sheets) for Sunrise, Sunset, and Twilight in Earth Systems.
Calculate and visualize the yearly timing and duration of the sun moving between two selected sun angles for the selected latitude.

Times and Durations of Twilight
Interactive spreadsheet (Google Sheets) for Sunrise, Sunset, and Twilight in Earth Systems.
Calculate and visualize the yearly timing and duration of the three stages of twilight with latitude.

Times and Durations when Above Sun Angle
Interactive spreadsheet (Google Sheets) for Sun Angle and Beam Concentration in Earth Systems.
Calculate and visualize the yearly timing and duration when the sun is at and above the selected sun angle for the selected latitude.

Transformations
Simulation and Practice for Function Transformations in Observing.
For the two quizzes, earn a personalized certificate of accomplishment with a minimum score of 4 correct answers in 5 tries.
There are 9 activities:
1. Create a random function, f(x), and change the a, b, h, and k values to create g(x).
2-4: Based on the graphs of f(x) and g(x), identify which one, two, or three of the four coefficients create(s) g(x) from f(x).
5: Use the randomly generated scenarios to quiz yourself to identify which of the four coefficients are creating g(x).
6-9: are similar to 2-5 except now you must identify the values of a, b, h, and k.

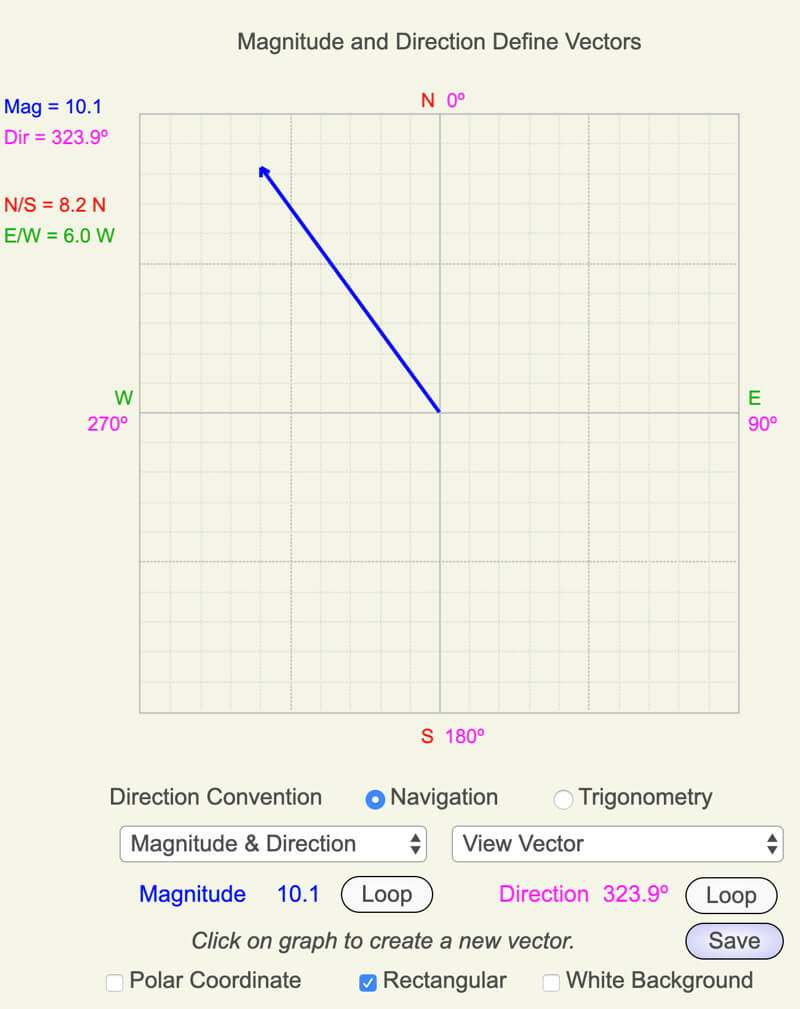
Vectors
Simulation and Practice for Right Triangles and Vectors in Earth Systems.
Visualize, conceptualize, estimate, and calculate vectors. The app is a simulation app since the vector responds to changed variables and a practice app since there are unlimited problems that provide visual, written, numerical, and mathematical feedback based on your answers.
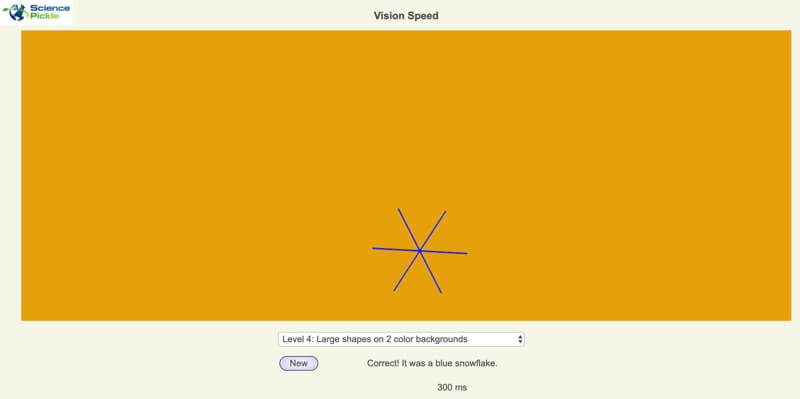
Vision Speed
Tool for Speed of Vision in Observing
Measure how quickly you can identify the color and shape of an object that appears briefly for a variety of conditions: simple backgrounds and large objects to textured backgrounds and small objects.
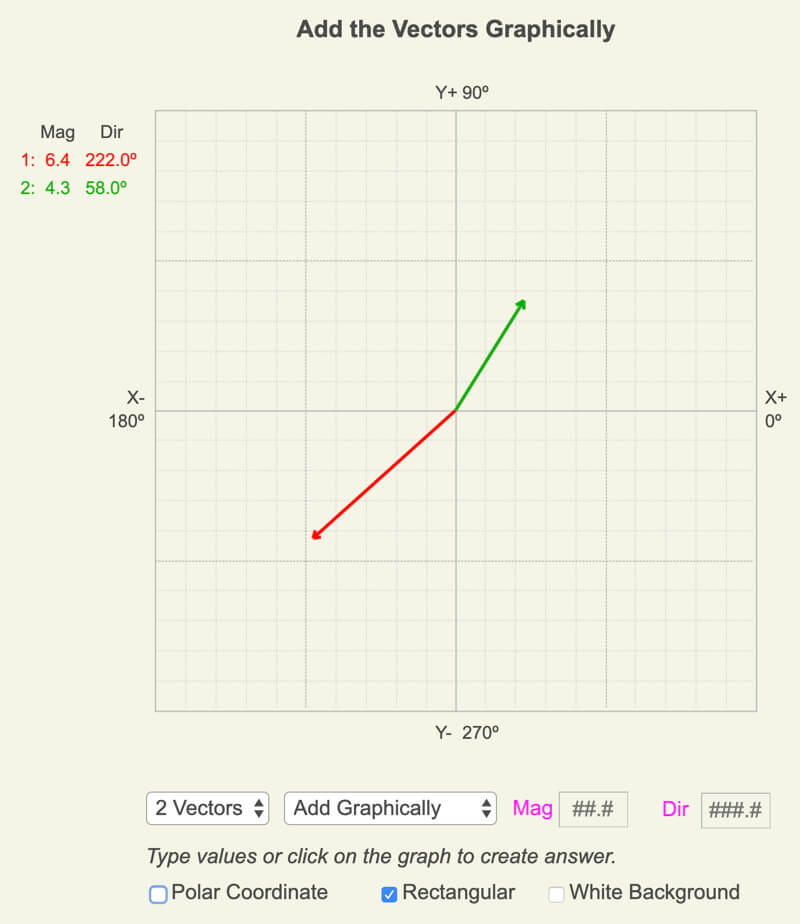
Visually Adding Vectors
Simulation for Adding Vectors in Earth Systems.
To help visualize the steps when adding two or three vectors using the tail-to-tip method, try the web app, Visually Adding Vectors.

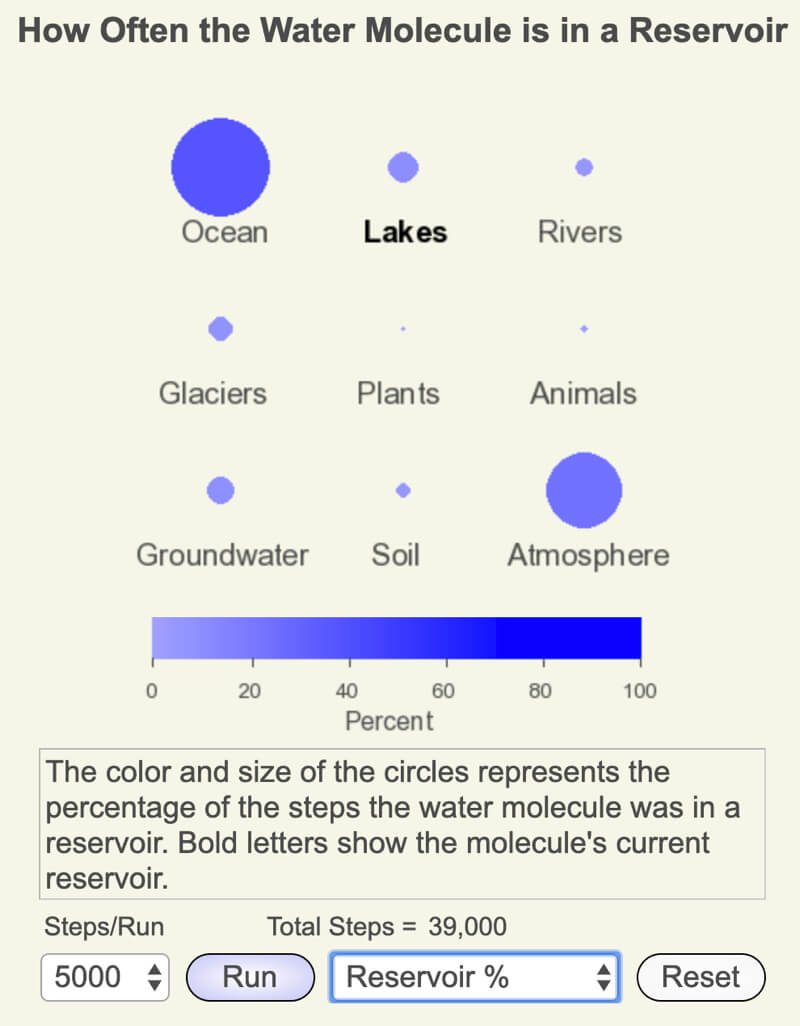
Water Cycle
Simulation for Precipitation and the Water Cycle in Earth Systems.
Interactively explore how a water molecule moves between the nine primary reservoirs of the water cycle. There are eight visualizations of the reservoirs and the processes that transfer the molecule between them.
Desktop Apps
Mac (OSX) users: Download the zipped dmg file. Uncompress then double click on the dmg file. Drag the folder icon that pops up to the application folder icon. To run the software, go to your Applications folder and double click the Earth, Wind, and Forces file.
Windows (PC) users: Select the location you want to put the files before uncompressing everything in the zip file.
App Title
Link for App
Description
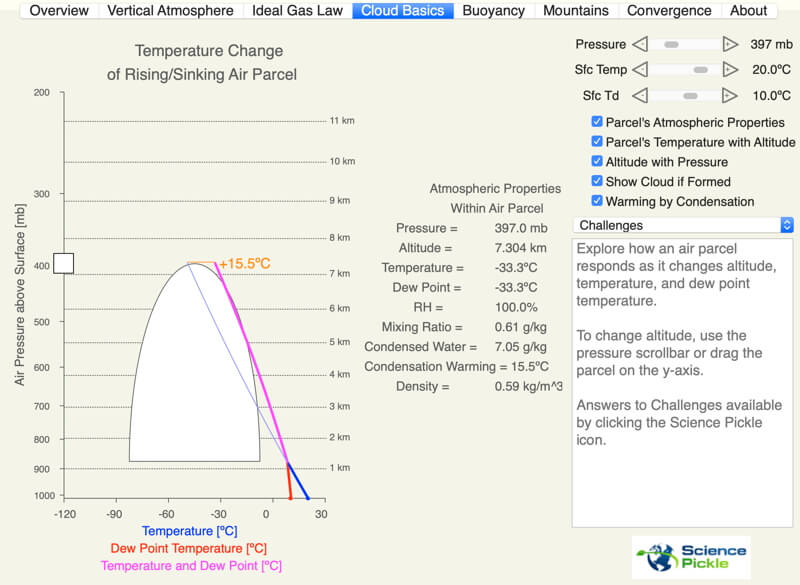
Atmosphere, Clouds, and Precipitation
Explore Earth’s vertical atmosphere around the globe at during winter and summer, the Ideal Gas Law and how it affects air rising from the Earth’s surface, and how mountains, buoyancy, and convergence create Earth’s weather.
Acknowledgments: Sophia Cannizzaro, Max Hall, Hyowon (Raphi) Kang, Corey Rost, and Will Tucker provided insightful feedback during beta testing.
Activities support the Atmosphere, Clouds, and Precipitation sections in Earth Systems.
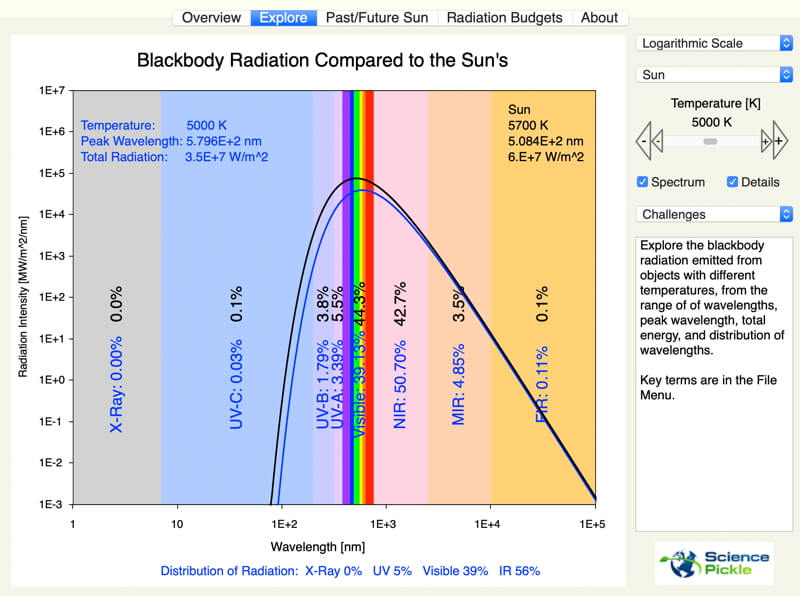
Blackbody Radiation
Explore the spectrum of radiation emitted from objects with a range of temperatures. Relate the amounts and types of radiation emitted to Earth system processes, including how the Sun has changed and will change, over billions of years.
Acknowledgments: Denise Alfonso, Lincoln Berkley, Xiomara Contreras, Allison Culbert, Wilder Daniel, Carolina Diez, Mason Glidden, Alan Gould, Hyowon (Raphi) Kang, Becca Kranz, Audrey Lin, Mike Pappas, Kiley Remiszewski, and Corey Rost provided insightful feedback during beta testing.
Activities support Radiation in Earth Systems.
Earth, Wind, and Forces
Explore the basics about vectors and how they are added, and relate these to forces which make Earth’s fluids move, including our atmosphere.
Acknowledgments: Thanks to Allison Culbert, Mason Glidden, Hyowon (Raphi) Kang, and Corey Rost for their contributions during beta testing.
Activities support the Vectors and Forces and Earth, Wind, and Forces sections in Earth Systems.
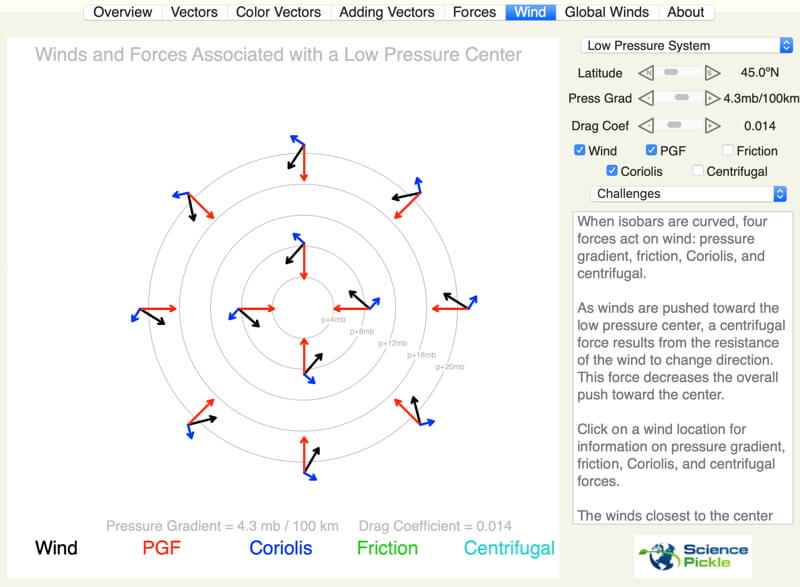
Math of Winds
Wind calculations are based on Roland Stull’s online book “Practical Meteorology: An Algebra-based Survey of Atmospheric Science“, in particular, Chapter 10 “Atmospheric Forces and Wind.” This book is an invaluable resource for those wanting to dive into the mathematical analysis of atmospheric phenomena.
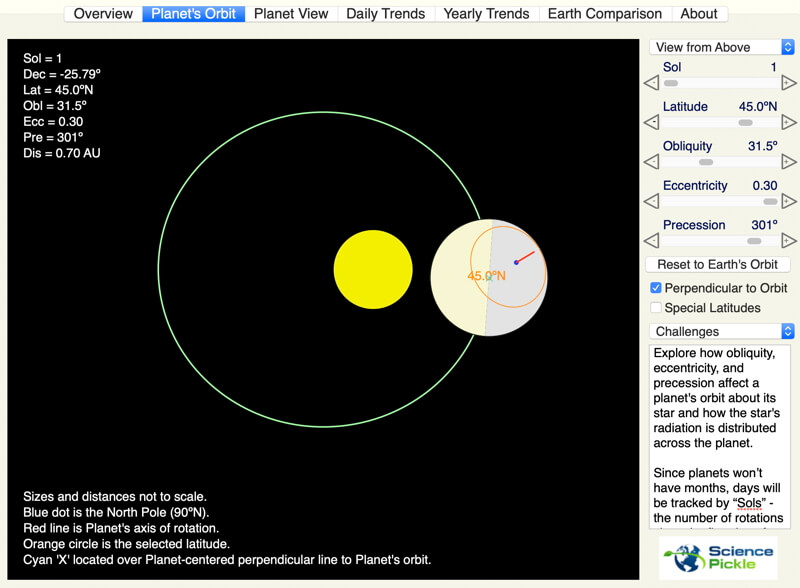
Star-Planet Connection
Explore how changes in a planet’s orbit (obliquity, eccentricity, and precession) affect its radiation budget. Small changes in Earth’s orbit help create long-term cycles in climate change.
Acknowledgments: Mason Glidden, Alan Gould, and Mattea Horne provided important feedback during beta testing.
Activities support Star-Planet Connection in Earth Systems.
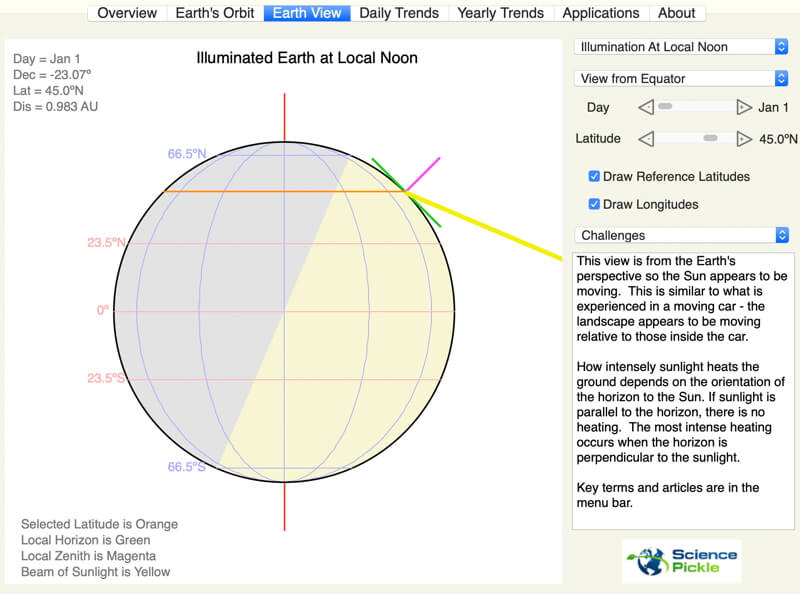
Sun-Earth Connection
Explore how the Earth’s orbit, rotation, and shape create the seasons, night-day heating patterns, and climate regimes for any latitude on Earth and for any date of the year. There are also explorations of how we apply these patterns of illumination as a clock, compass, and calendar.
Acknowledgments: Denise Alfonso, Lincoln Berkley, Xiomara Contreras, Allison Culbert, Wilder Daniel, Carolina Diez, Mason Glidden, Alan Gould, Hyowon (Raphi) Kang, Becca Kranz, Audrey Lin, Mike Pappas, Kiley Remiszewski, and Corey Rost provided invaluable feedback during beta testing.
Activities support Sun-Earth Connection in Earth Systems.
Mathematical Sources for Sun-Earth and Star-Planet Connection Software
The most important calculation was to be able to locate the planet on its orbital path for any given day (or sol) of the year. This article was invaluable in illustrating how to use a reference circle centered on the center of the elliptical orbit and with a radius of the semi-major axis of the ellipse.
Kepler’s Laws are critical to apply as well.
Earth’s insolation calculations apply to other planets by modifying key parameters, such as distance between star and planet and the amount of radiation emitted from the star.
0 Comments